Fig. 4
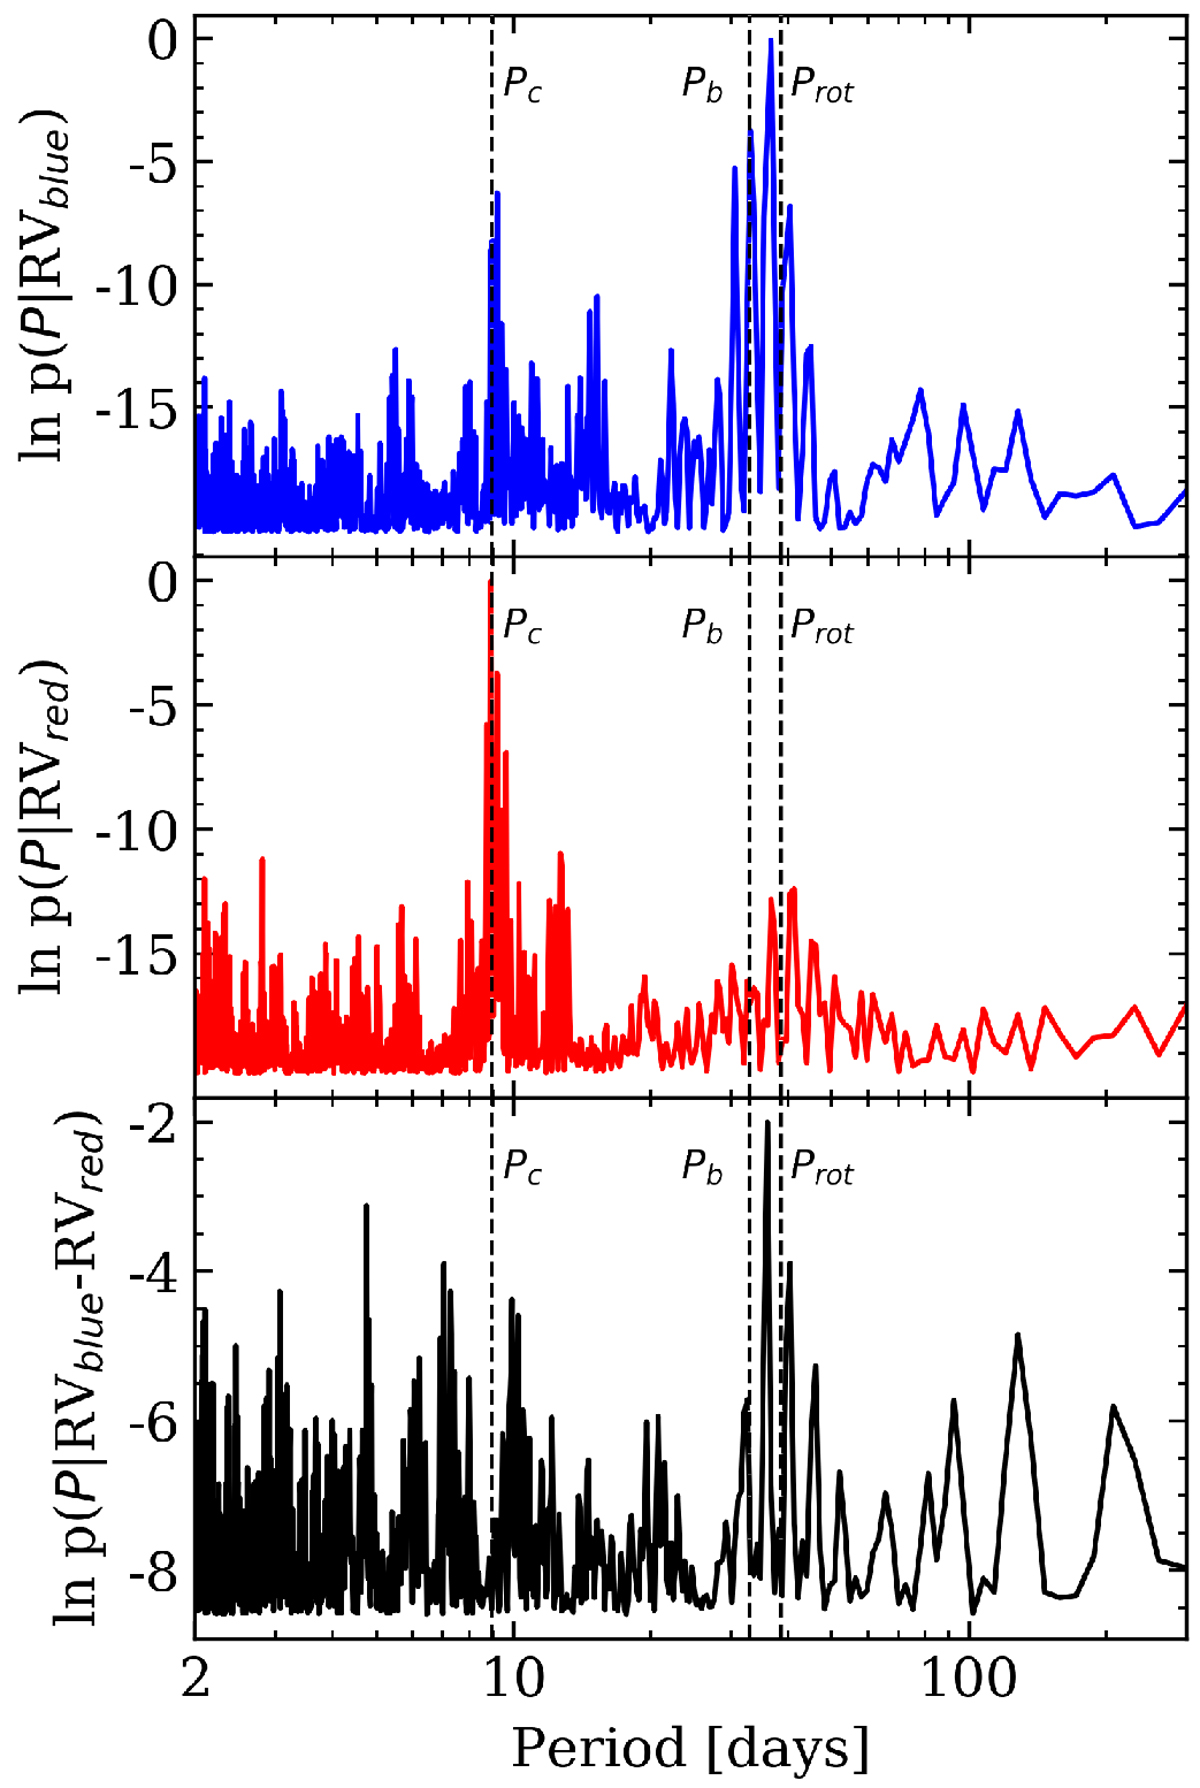
Bayesian generalized Lomb–Scargle periodograms of the blue (top panel), red (middle panel), and HARPS RVs and their difference (bottom panel). The three dashed vertical lines depict the orbital period of the planets K2-18b and c (Pc ~ 9 days), and the photometric stellar rotation period. The 9-day signal is seen in the first two time-series, but at a lower probability in the blue likely due to the higher levels of stellar activity in that wavelength regime. The 9-day signal is suppressed in the GLSP of the RV difference, while some residual probability close to Prot continues topersist due to the incomplete removal of stellar activity.
Current usage metrics show cumulative count of Article Views (full-text article views including HTML views, PDF and ePub downloads, according to the available data) and Abstracts Views on Vision4Press platform.
Data correspond to usage on the plateform after 2015. The current usage metrics is available 48-96 hours after online publication and is updated daily on week days.
Initial download of the metrics may take a while.