Fig. A.4
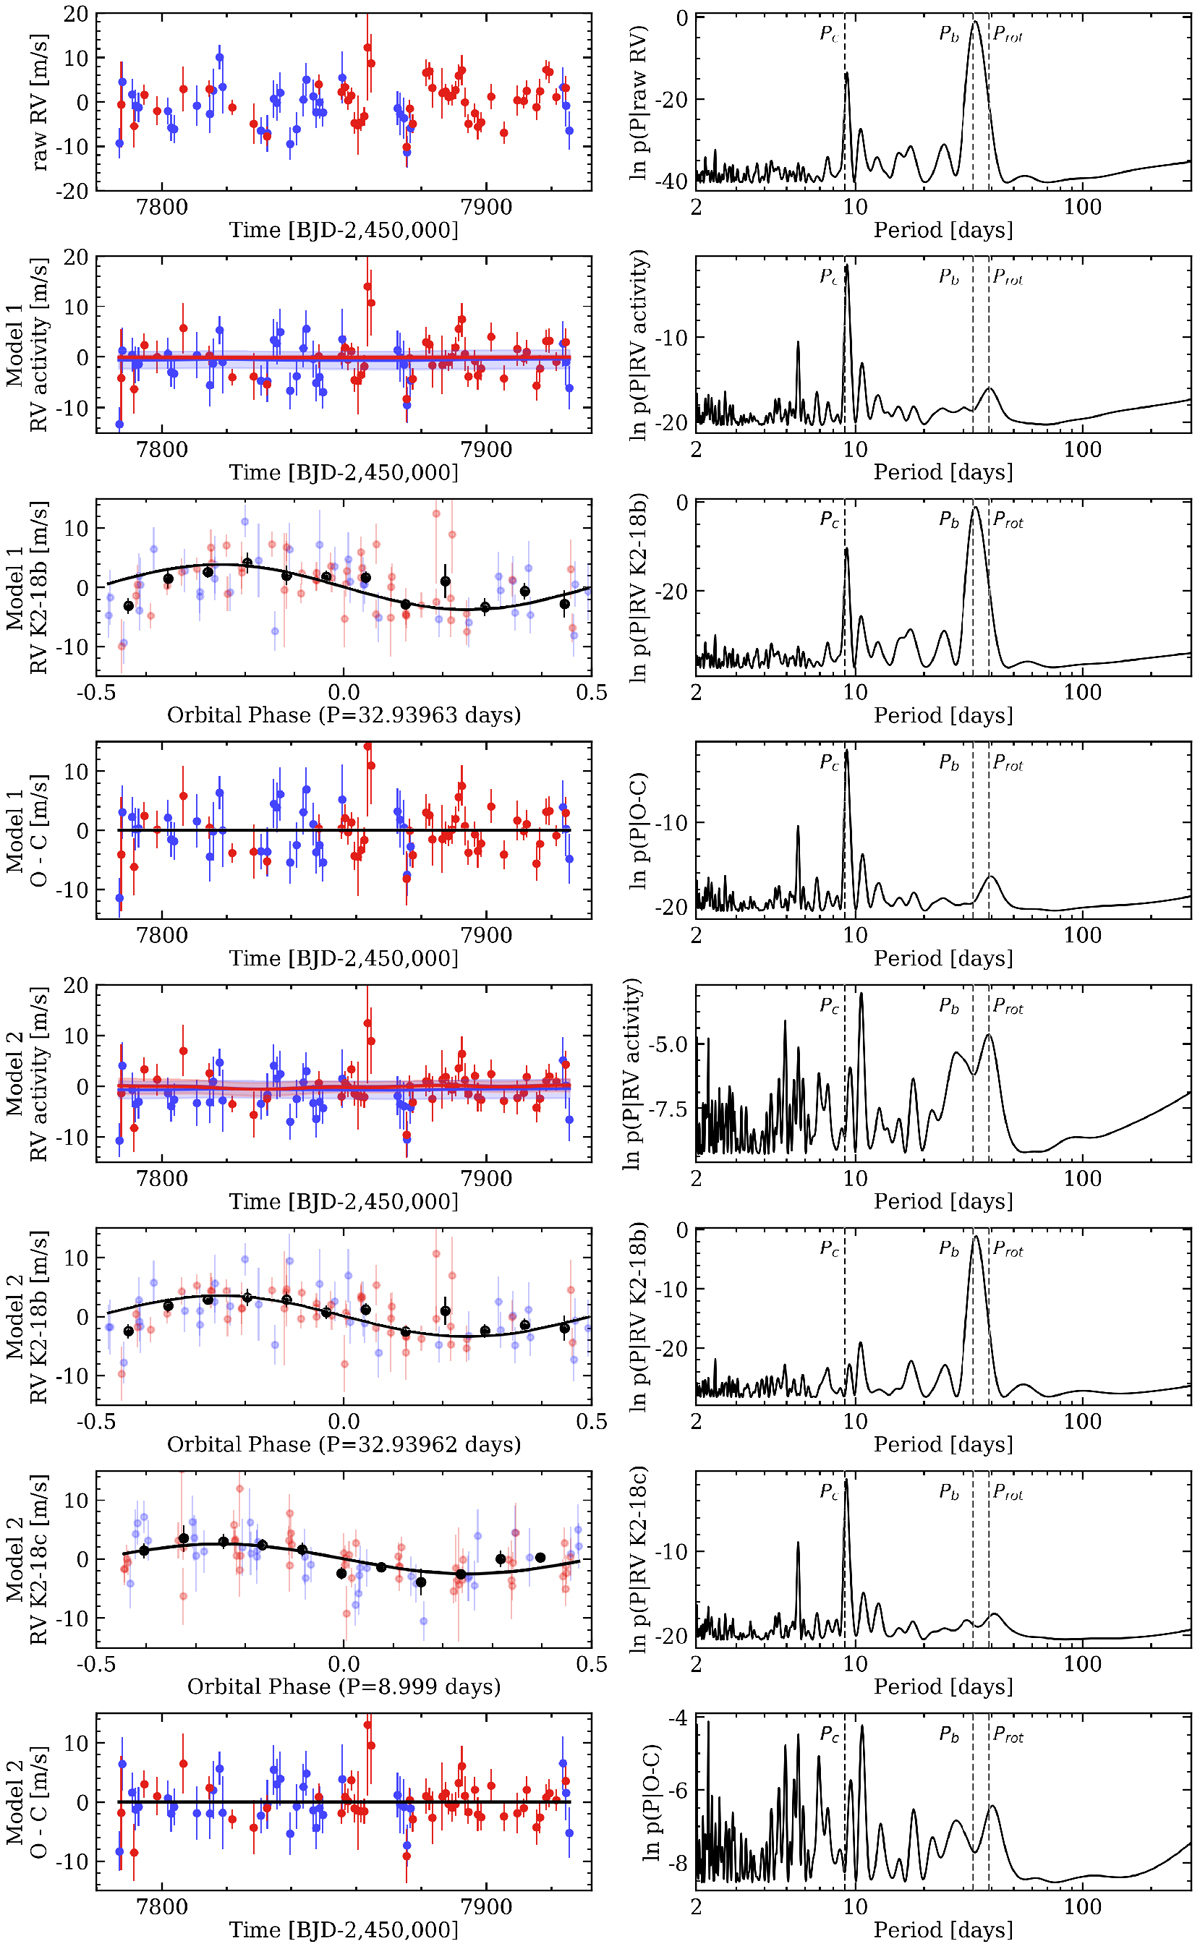
Similar to Fig. A.1, but for the 84 joint HARPS+CARMENES RVs obtained during the time interval in which the two spectrograph WFs overlap (February–June 2017). The HARPS and CARMENES RVs are plotted as blue and red markers, respectively. The phase-folded RVs depicting planetary signals are binned for clarity. The rms of the residual time-series assuming a one- and two-planet model are 4.26 and 3.62 m s−1, respectively.MAP RV models. GLSP periodicities.
Current usage metrics show cumulative count of Article Views (full-text article views including HTML views, PDF and ePub downloads, according to the available data) and Abstracts Views on Vision4Press platform.
Data correspond to usage on the plateform after 2015. The current usage metrics is available 48-96 hours after online publication and is updated daily on week days.
Initial download of the metrics may take a while.