Fig. 6.
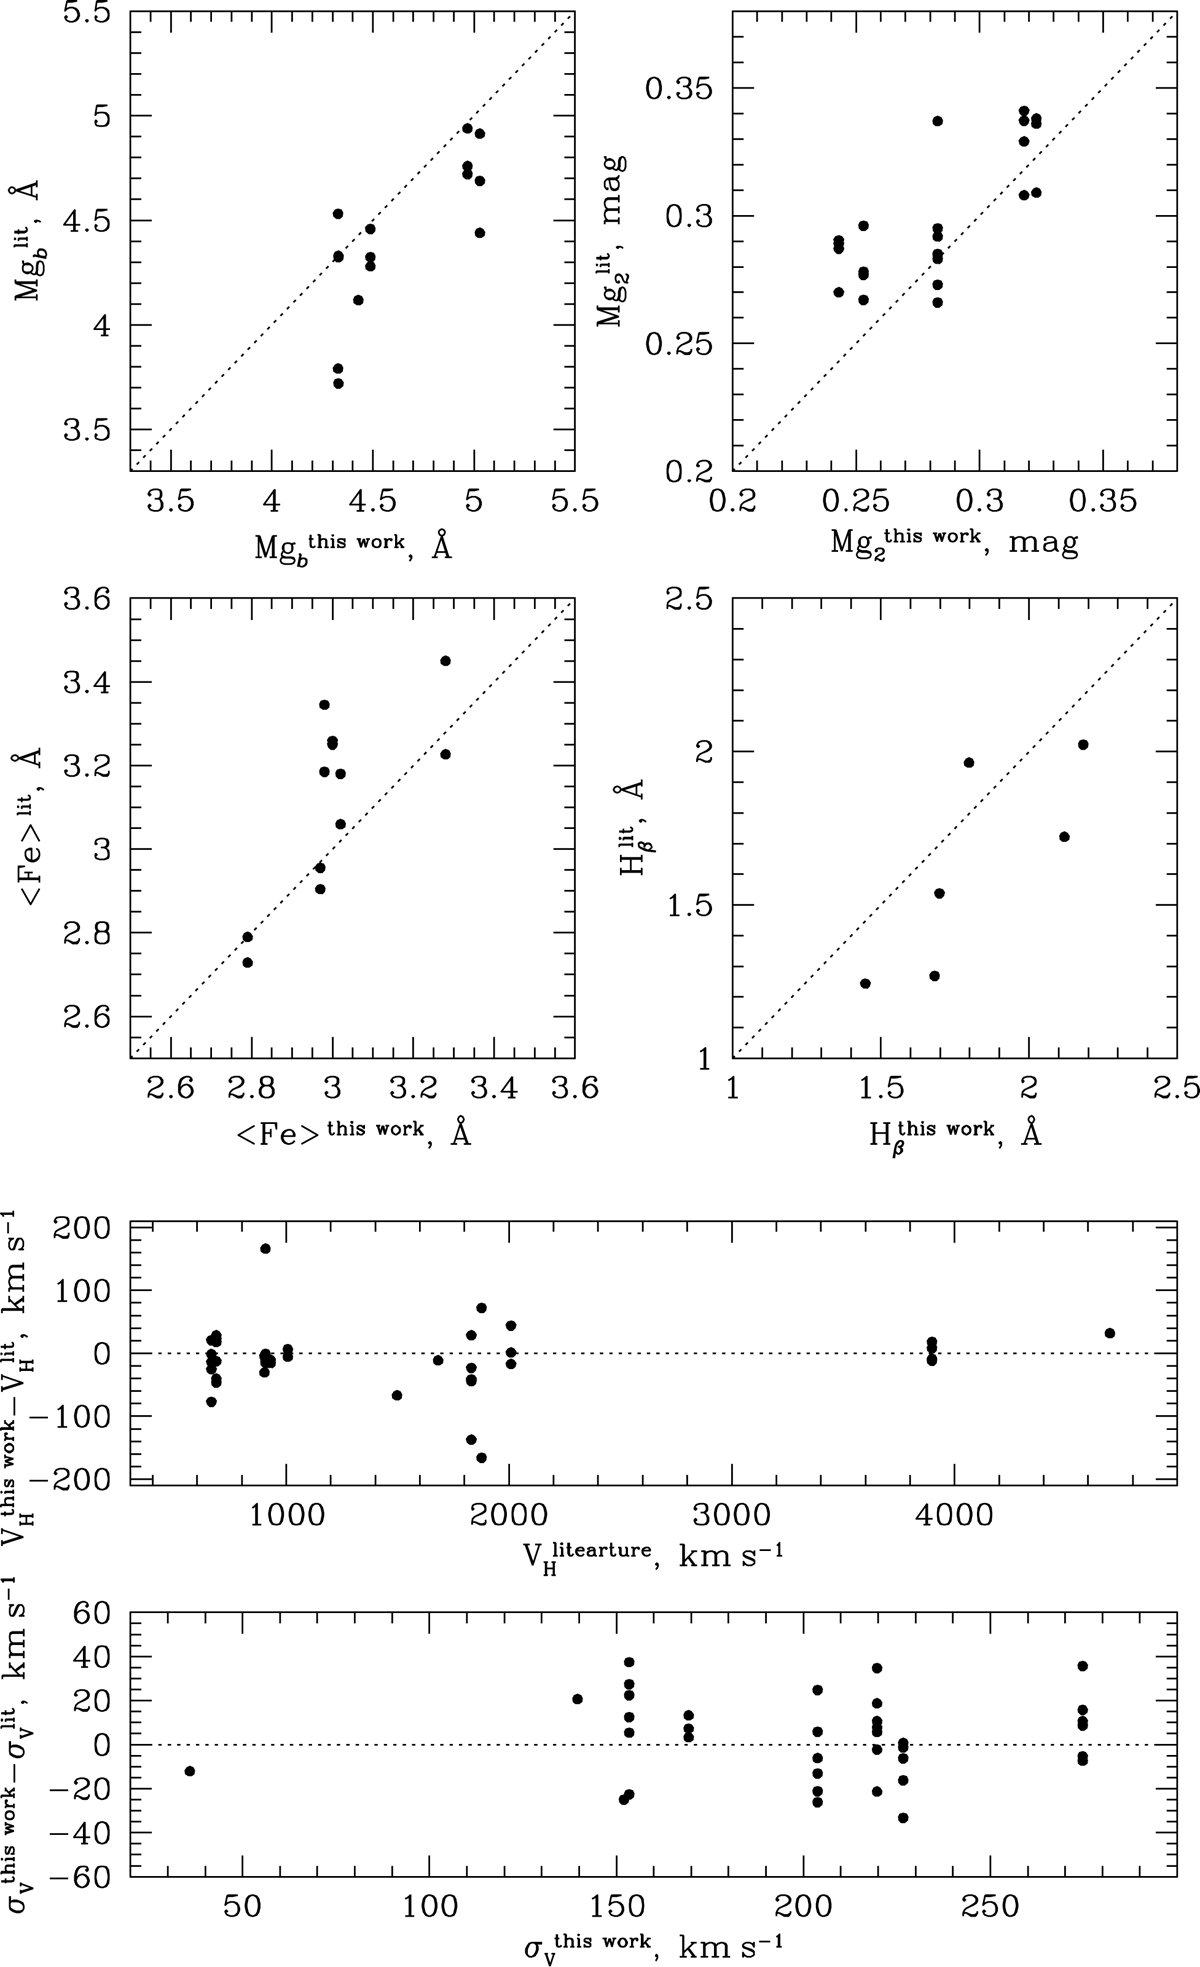
Upper panels: comparison between our measurements of Lick line-strength indices and those available in literature (Tables 3 and A.1–A.4). For uniformity we only show literature sources that include multiple galaxies from our sample. The plot intervals reflect the ranges of values from our measurements. Bottom panels: difference between our heliocentric velocities and velocity dispersion in the central region of the sample galaxies and those from literature as a function of the literature values. The average difference of 39 measurements after removing three outliers is consistent with zero (−7 ± 29 km s−1).
Current usage metrics show cumulative count of Article Views (full-text article views including HTML views, PDF and ePub downloads, according to the available data) and Abstracts Views on Vision4Press platform.
Data correspond to usage on the plateform after 2015. The current usage metrics is available 48-96 hours after online publication and is updated daily on week days.
Initial download of the metrics may take a while.