Fig. 2.
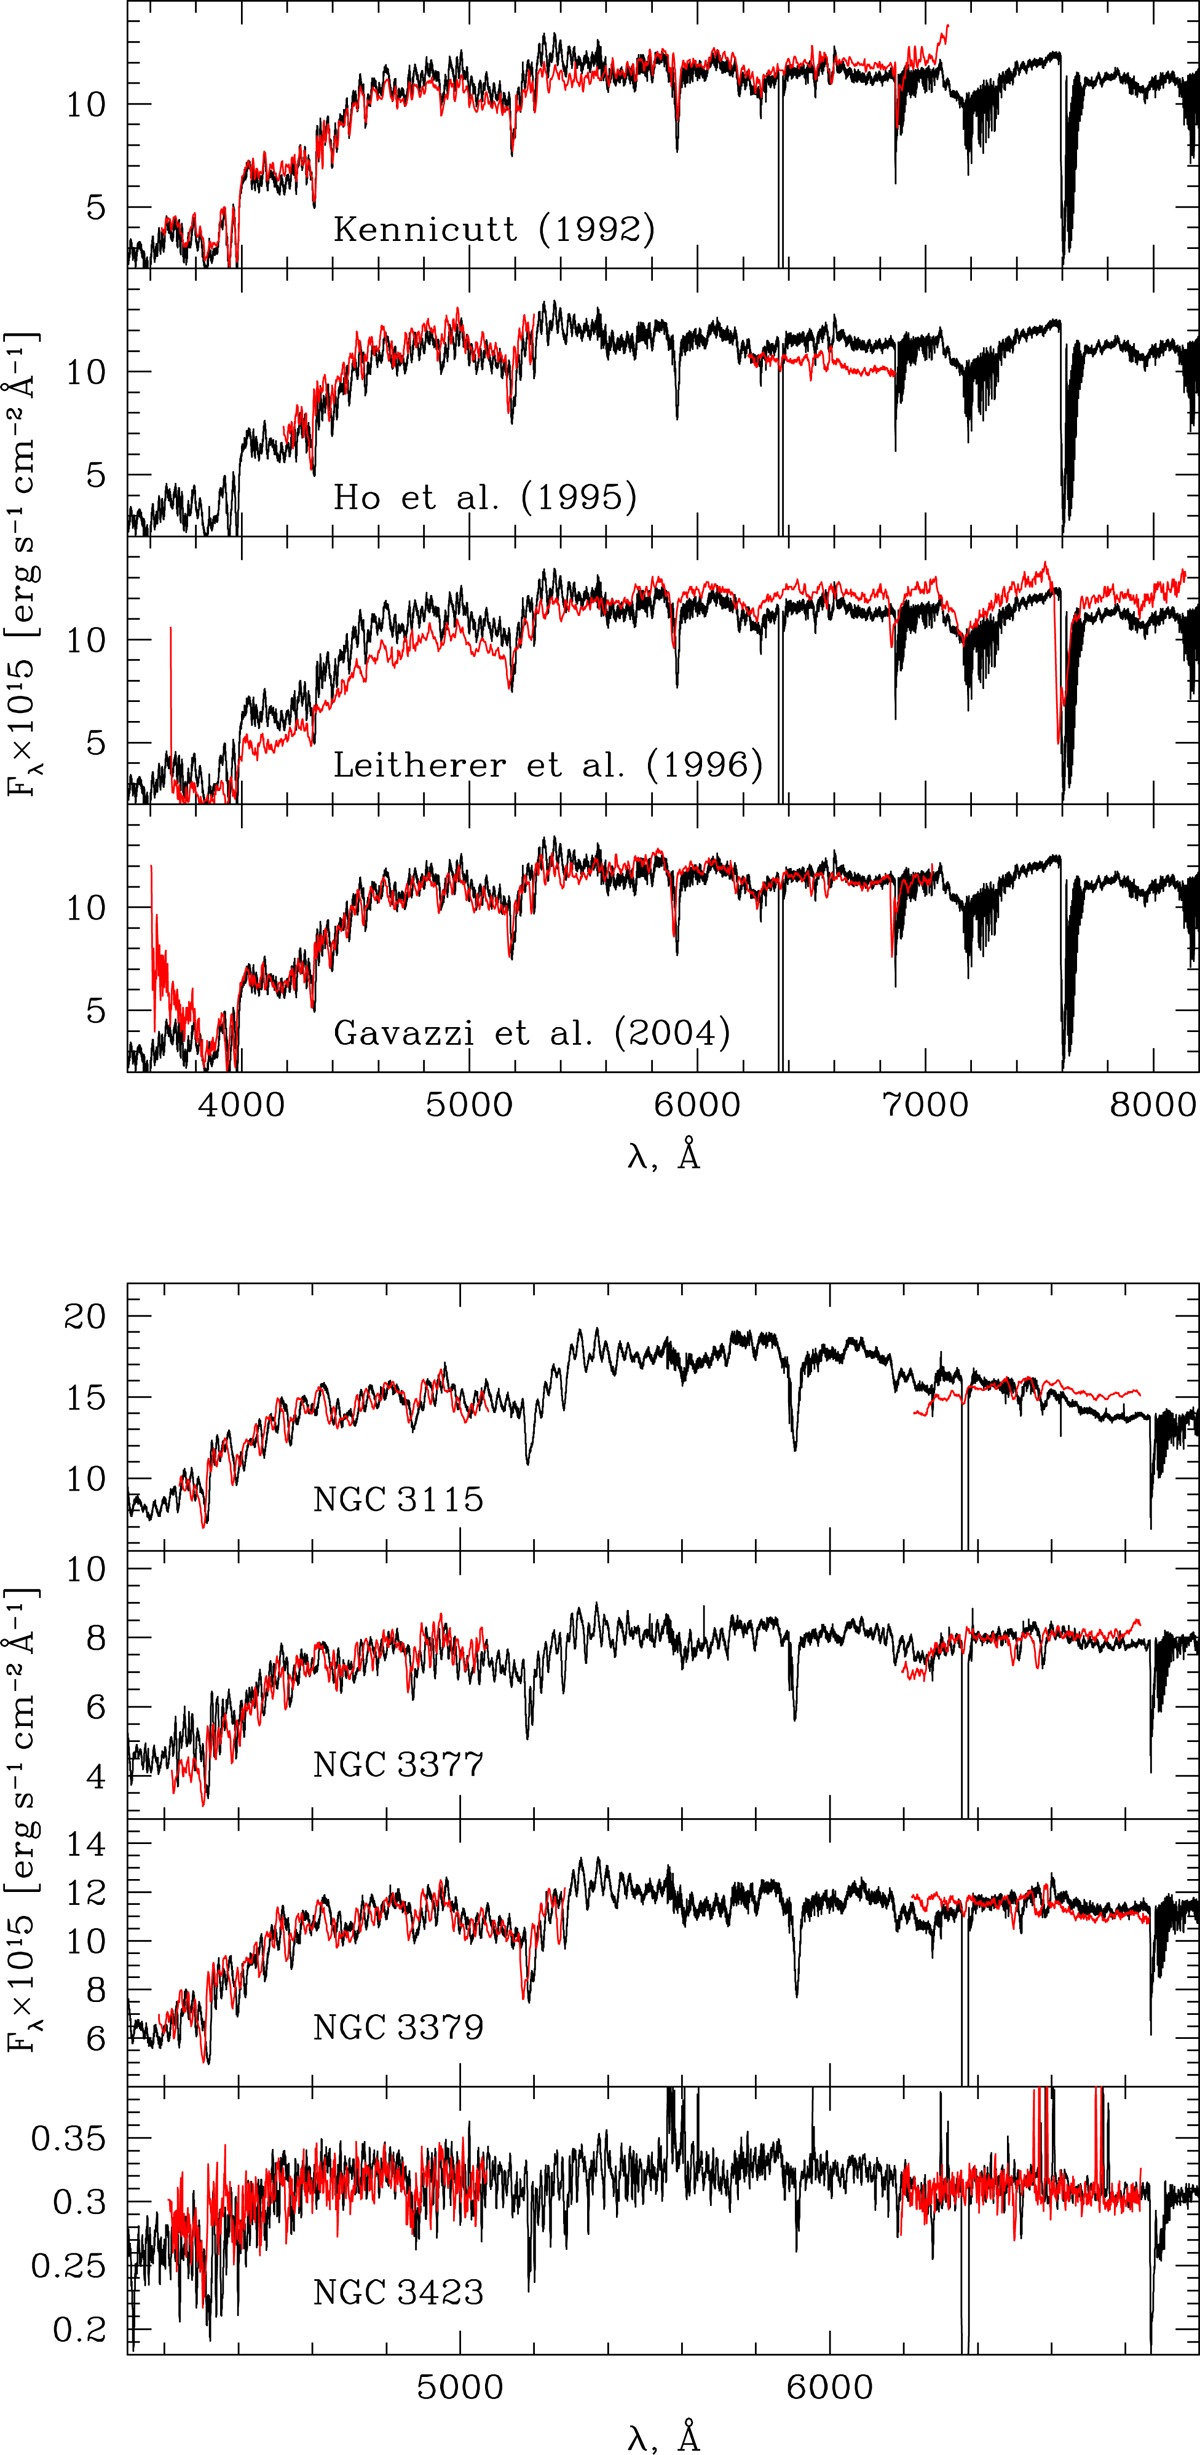
Comparison between our optical spectra (black lines) with literature spectra (red lines) scaled to match the flux level of ours. Top panels: spectra of NGC 3379 from different sources as given in the labels. Bottom panels: spectra of the four galaxies in common with Ho et al. (1995). Their spectra consist of two portions, which we separately scaled to match our spectrum.
Current usage metrics show cumulative count of Article Views (full-text article views including HTML views, PDF and ePub downloads, according to the available data) and Abstracts Views on Vision4Press platform.
Data correspond to usage on the plateform after 2015. The current usage metrics is available 48-96 hours after online publication and is updated daily on week days.
Initial download of the metrics may take a while.