Free Access
Fig. 1.
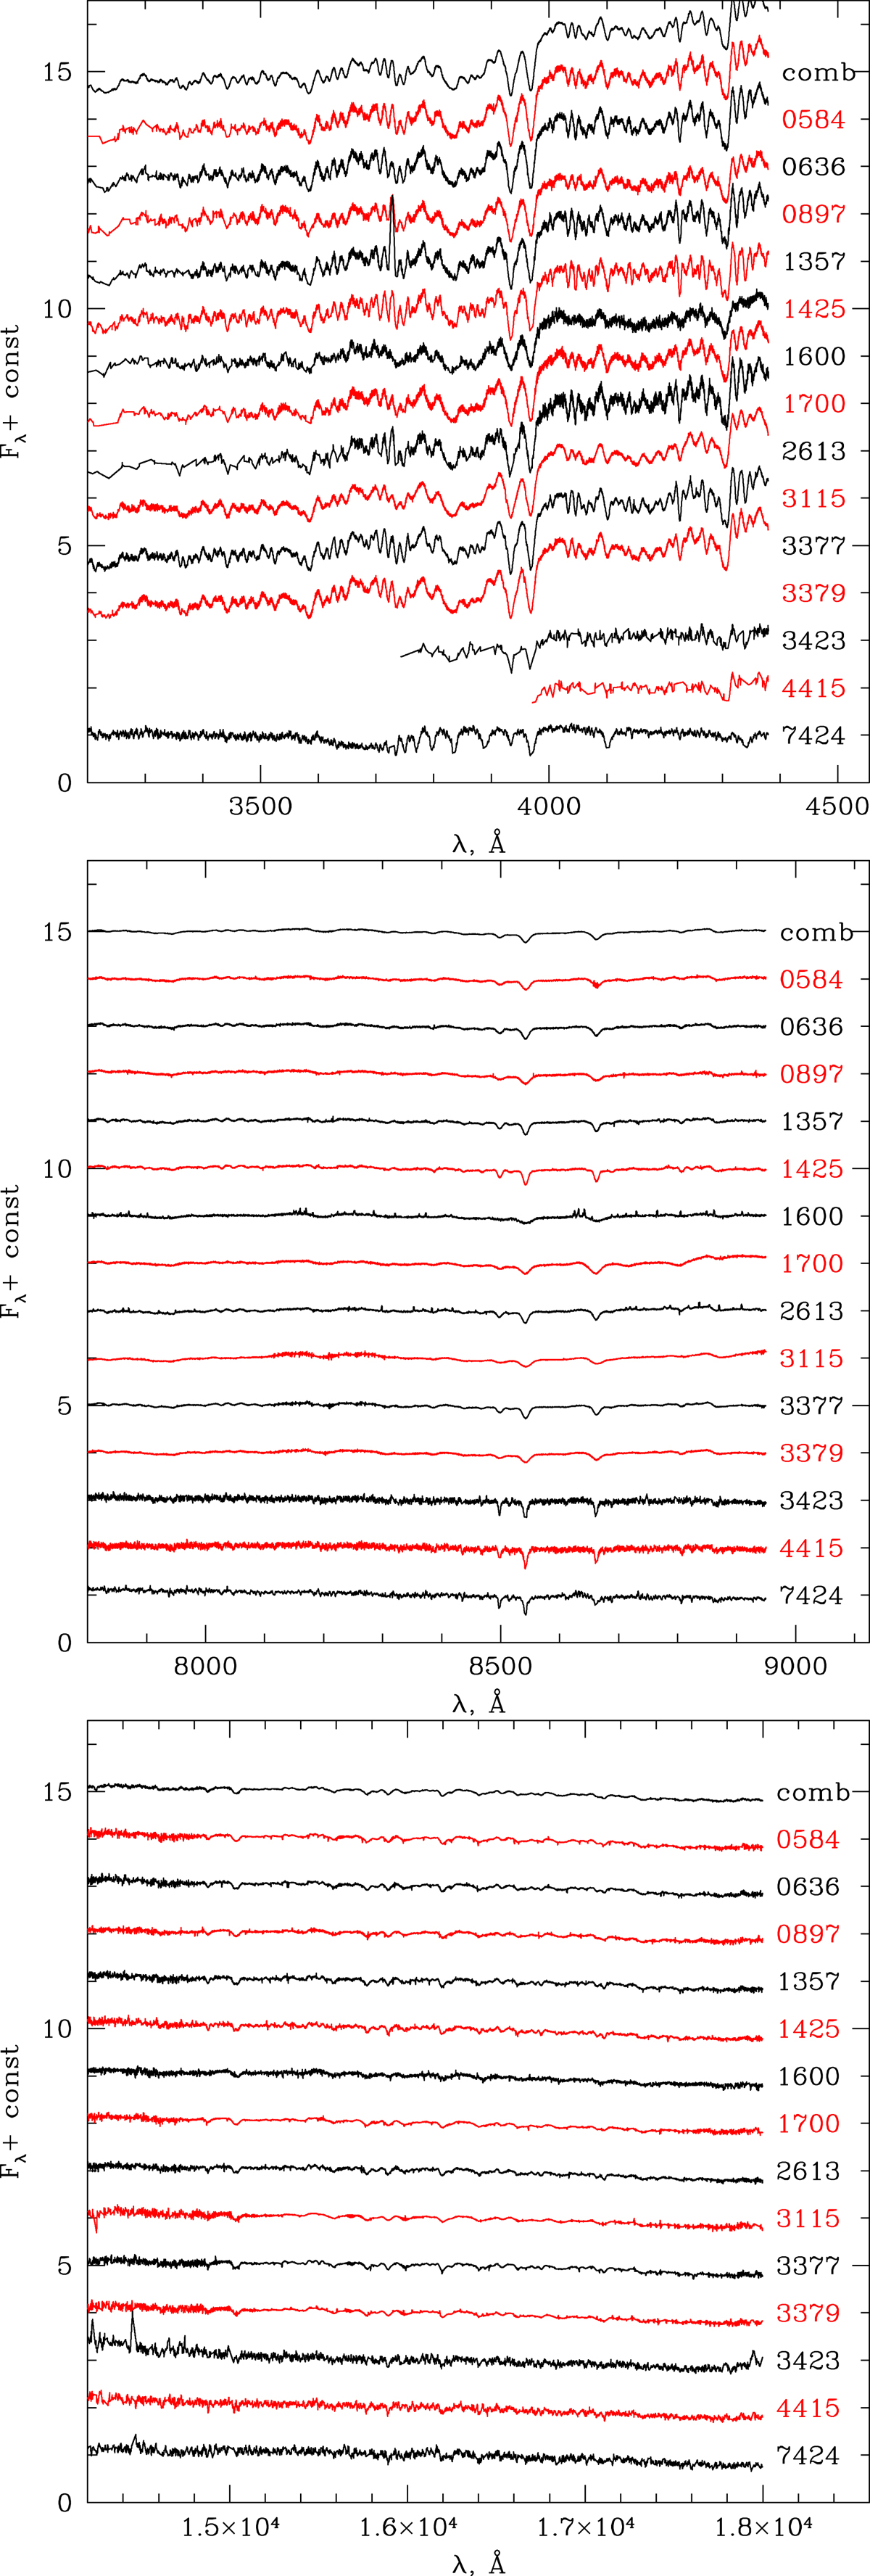
Spectra of the sample galaxies in different wavelength ranges. Each spectrum is normalized to unity, shifted for displaying purposes, and labeled with the NGC number of the galaxy. The spectra at the top of each panel are the average of the sample spectra (see Sect. 3).
Current usage metrics show cumulative count of Article Views (full-text article views including HTML views, PDF and ePub downloads, according to the available data) and Abstracts Views on Vision4Press platform.
Data correspond to usage on the plateform after 2015. The current usage metrics is available 48-96 hours after online publication and is updated daily on week days.
Initial download of the metrics may take a while.