Fig. 5.
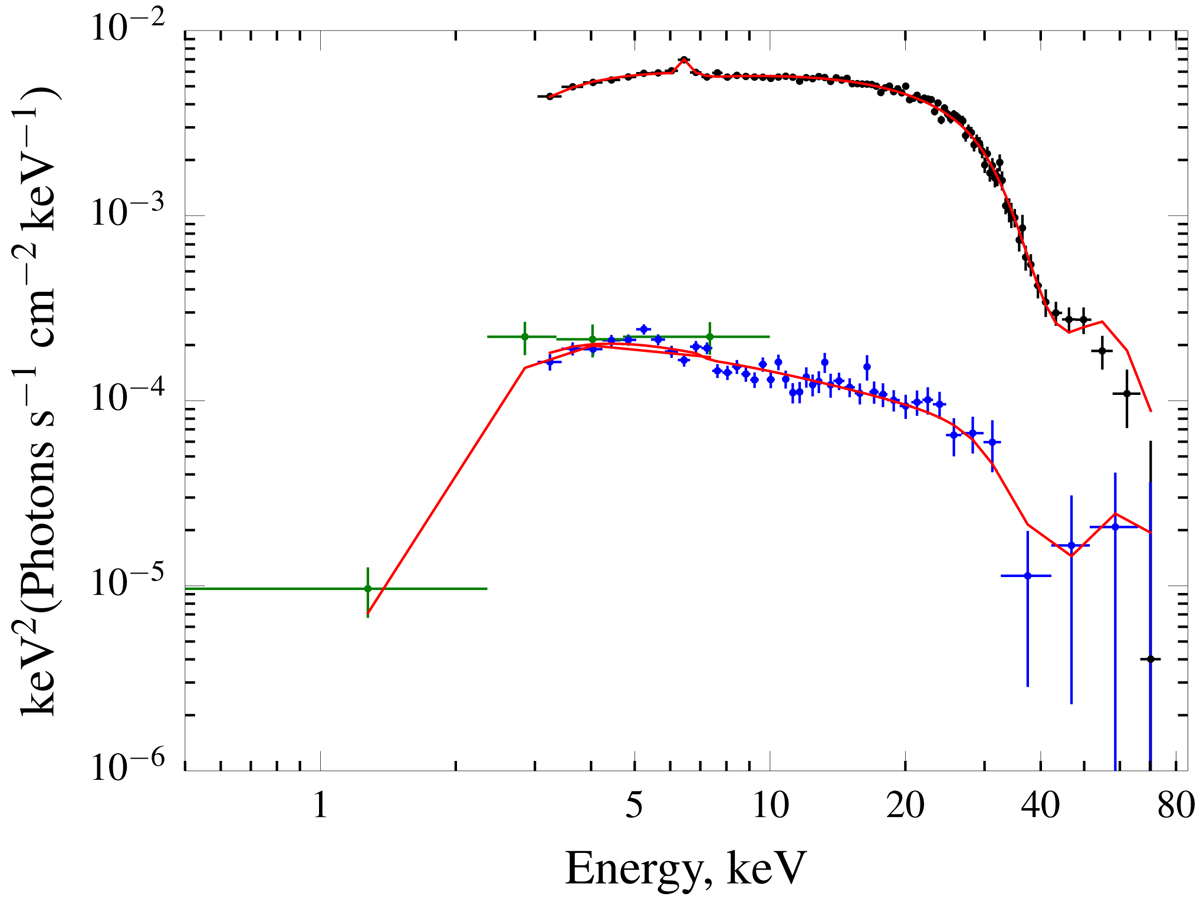
Spectral energy distribution of IGR J19294+1816 obtained with the Swift/XRT and NuSTAR telescopes during the high (black dots) and low (blue and green dots) intensity states. The data from the two NuSTAR units are added together for plotting (but not for actual fit). Solid lines represent best-fit models for each observation including fundamental line only (see text).
Current usage metrics show cumulative count of Article Views (full-text article views including HTML views, PDF and ePub downloads, according to the available data) and Abstracts Views on Vision4Press platform.
Data correspond to usage on the plateform after 2015. The current usage metrics is available 48-96 hours after online publication and is updated daily on week days.
Initial download of the metrics may take a while.