Fig. 4.
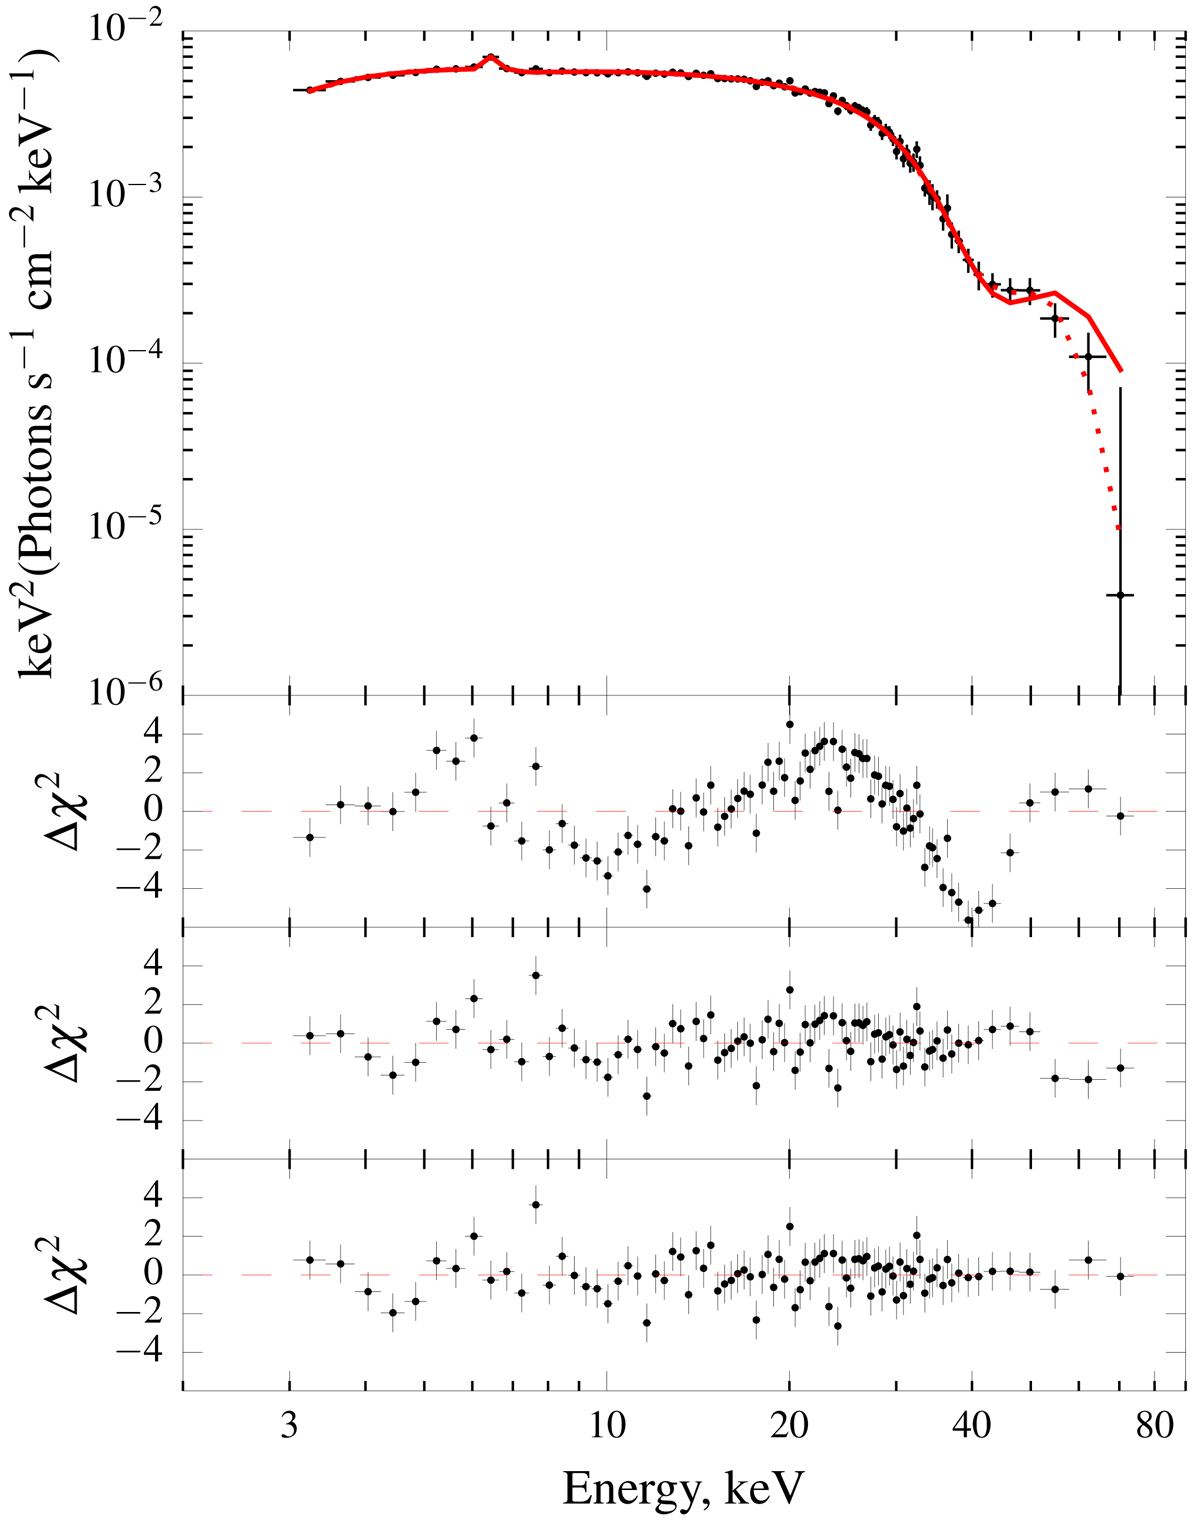
Spectrum of IGR J19294+1816 obtained with the NuSTAR telescopes during the high state. The data from the two NuSTAR units are added together for plotting (but not for actual fit). The best-fitting residuals for models (top to bottom) without inclusion of the absorption feature, with fundamental only (at ∼42.8 keV; shown with the solid line in the top panel), and including the first harmonics (at ∼85 keV, dotted line in the top panel) are also shown.
Current usage metrics show cumulative count of Article Views (full-text article views including HTML views, PDF and ePub downloads, according to the available data) and Abstracts Views on Vision4Press platform.
Data correspond to usage on the plateform after 2015. The current usage metrics is available 48-96 hours after online publication and is updated daily on week days.
Initial download of the metrics may take a while.