Fig. 1.
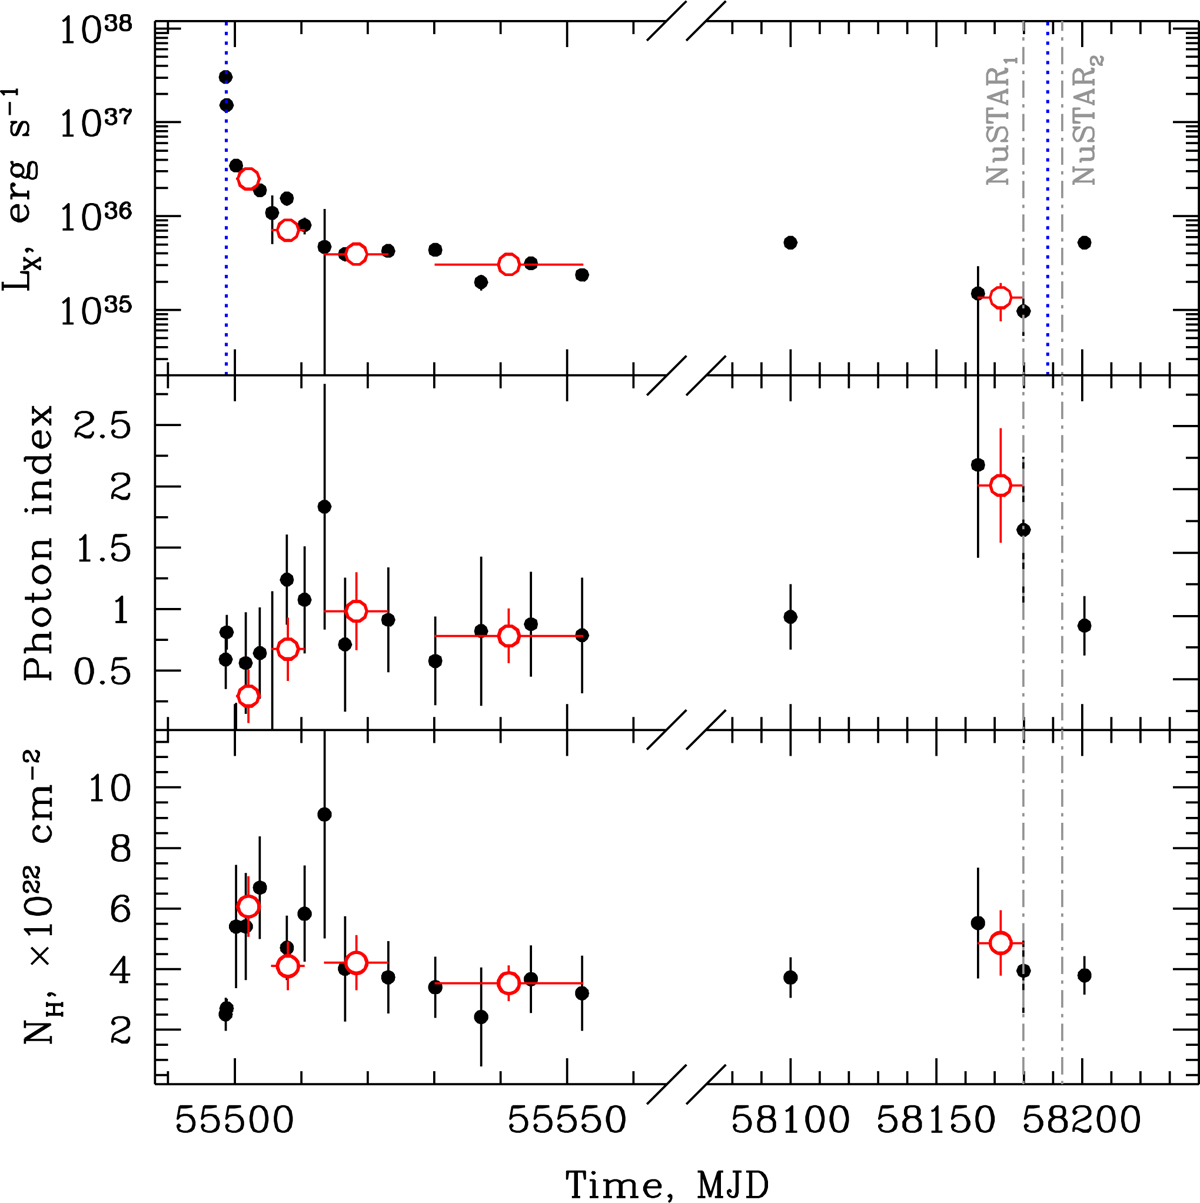
Top panel: bolometrically corrected light curve of IGR J19294+1816 obtained with the Swift/XRT telescope in 2010 (left side) and 2017–2018 (right side) assuming distance to the source 11 kpc. Blue dotted lines show moments of periastron passages (see Sect. 3.4). Middle and bottom panels: corresponding evolution of the power law photon index and absorption value assuming an absorbed power law model. Black points correspond to individual XRT observations, whereas red open circles represent parameters obtained from the averaging of a few nearby observations with low count statistics. Vertical dash-dotted lines show moments of the NuSTAR observations.
Current usage metrics show cumulative count of Article Views (full-text article views including HTML views, PDF and ePub downloads, according to the available data) and Abstracts Views on Vision4Press platform.
Data correspond to usage on the plateform after 2015. The current usage metrics is available 48-96 hours after online publication and is updated daily on week days.
Initial download of the metrics may take a while.