Fig. 6.
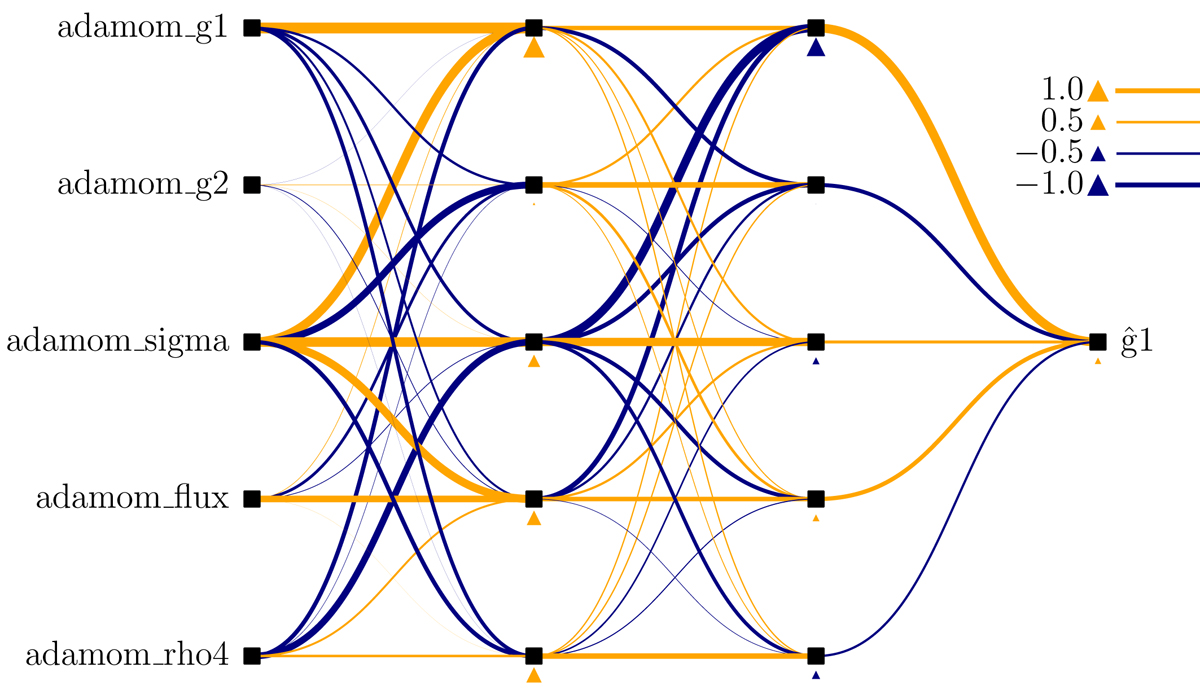
Visualization of one NN from the committee predicting a shear point estimate ĝ1, trained for the fiducial experiment. The NN nodes are represented by black squares, in a configuration with only two hidden layers of five nodes each. The connections between these nodes depict the values of the NN weights, by their thickness and color. The NN biases are visualized by the triangles below the nodes. The legend gives the scale of these elements. From the relative amplitude of the weights, one can observe, for example, that adamom_g2 has relatively low impact, while adamom_sigma plays an important role in the prediciton of ĝ1. All input features are normalized prior to entering the NNs (see Sect. 3.4 for details).
Current usage metrics show cumulative count of Article Views (full-text article views including HTML views, PDF and ePub downloads, according to the available data) and Abstracts Views on Vision4Press platform.
Data correspond to usage on the plateform after 2015. The current usage metrics is available 48-96 hours after online publication and is updated daily on week days.
Initial download of the metrics may take a while.