Fig. A.1.
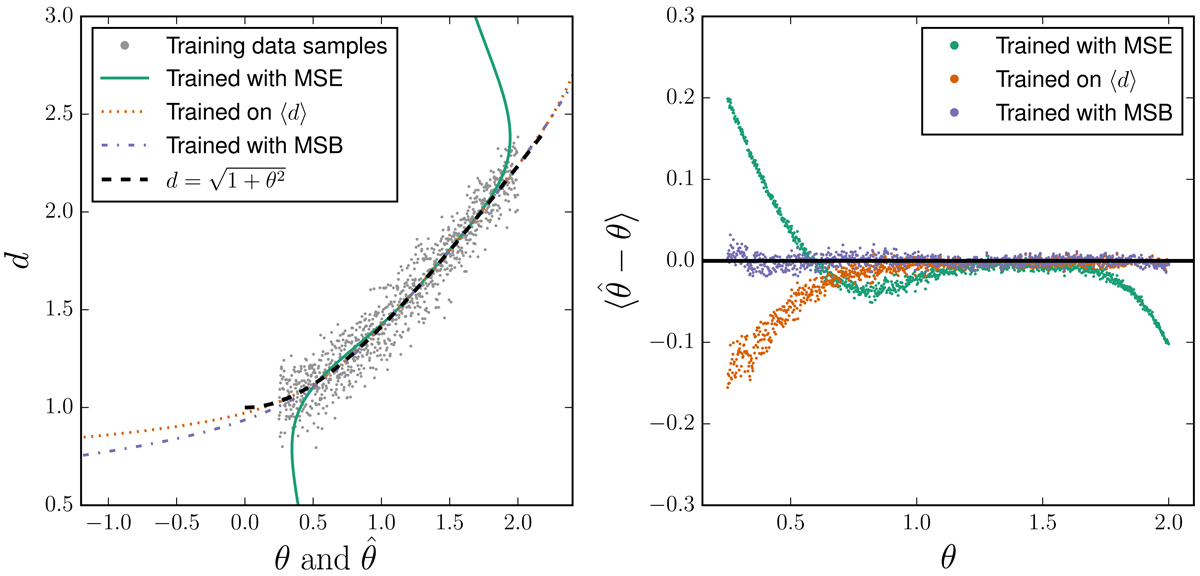
One-dimensional example of inverse regression ![]() of an explanatory variable θ from noisy observations of the dependent variable d. Left panel: a small number of samples of the training set as datapoints, and three different estimators corresponding to the same NN trained with three different error functions, as discussed in the text. Right panel: bias of each estimator as function of true θ.
of an explanatory variable θ from noisy observations of the dependent variable d. Left panel: a small number of samples of the training set as datapoints, and three different estimators corresponding to the same NN trained with three different error functions, as discussed in the text. Right panel: bias of each estimator as function of true θ.
Current usage metrics show cumulative count of Article Views (full-text article views including HTML views, PDF and ePub downloads, according to the available data) and Abstracts Views on Vision4Press platform.
Data correspond to usage on the plateform after 2015. The current usage metrics is available 48-96 hours after online publication and is updated daily on week days.
Initial download of the metrics may take a while.