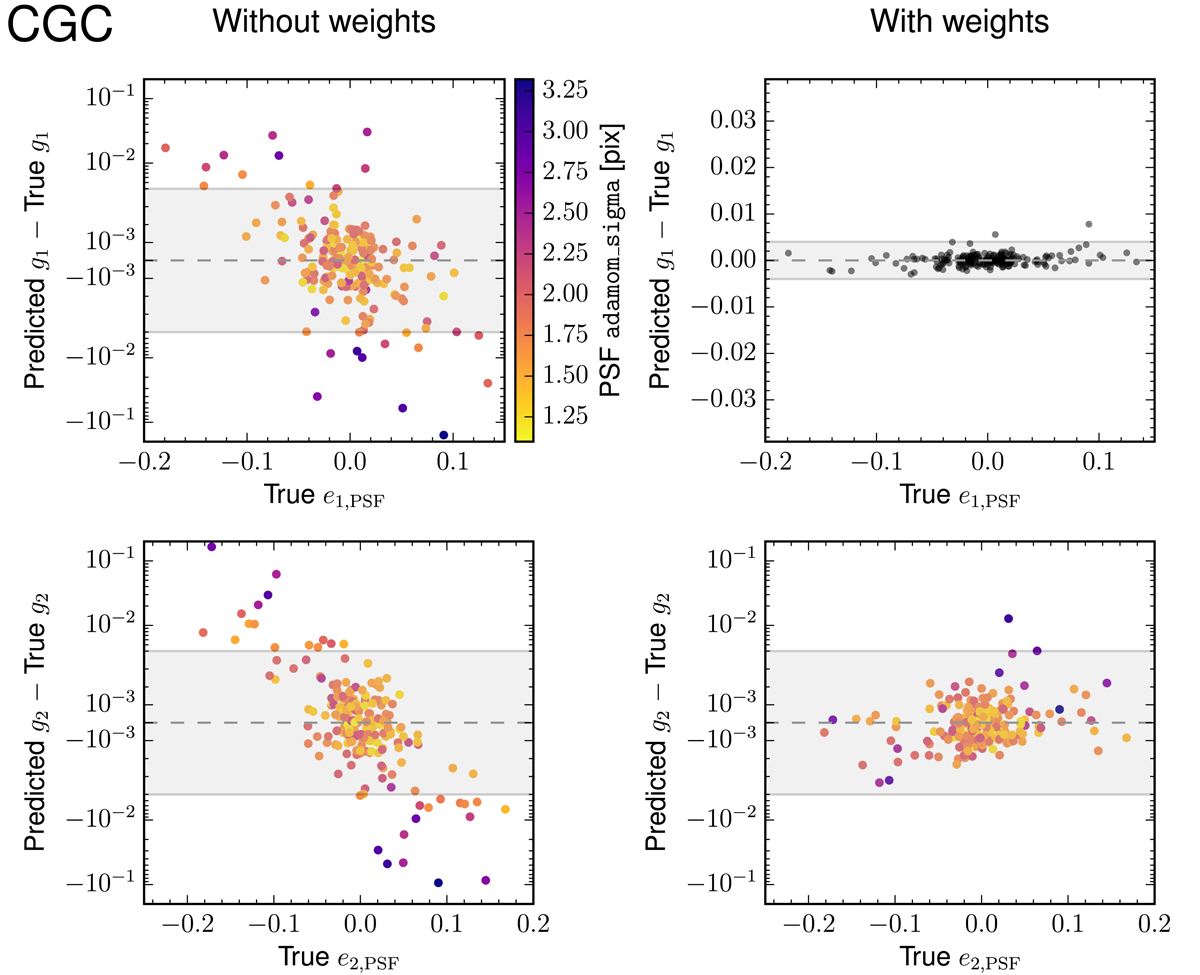
Fig. 25.

Multiplicative bias μ averaged over the components 1 and 2, against the additive bias c+ defined in the coordinate system of the PSF anisotropy. This figure can be directly compared with Fig. 17 of the GREAT3 result paper (Mandelbaum et al. 2015). Space branches are shown with dashed error bars. The axes are linear within the gray-shaded region, and logarithmic outside.
Current usage metrics show cumulative count of Article Views (full-text article views including HTML views, PDF and ePub downloads, according to the available data) and Abstracts Views on Vision4Press platform.
Data correspond to usage on the plateform after 2015. The current usage metrics is available 48-96 hours after online publication and is updated daily on week days.
Initial download of the metrics may take a while.


