Fig. 24.

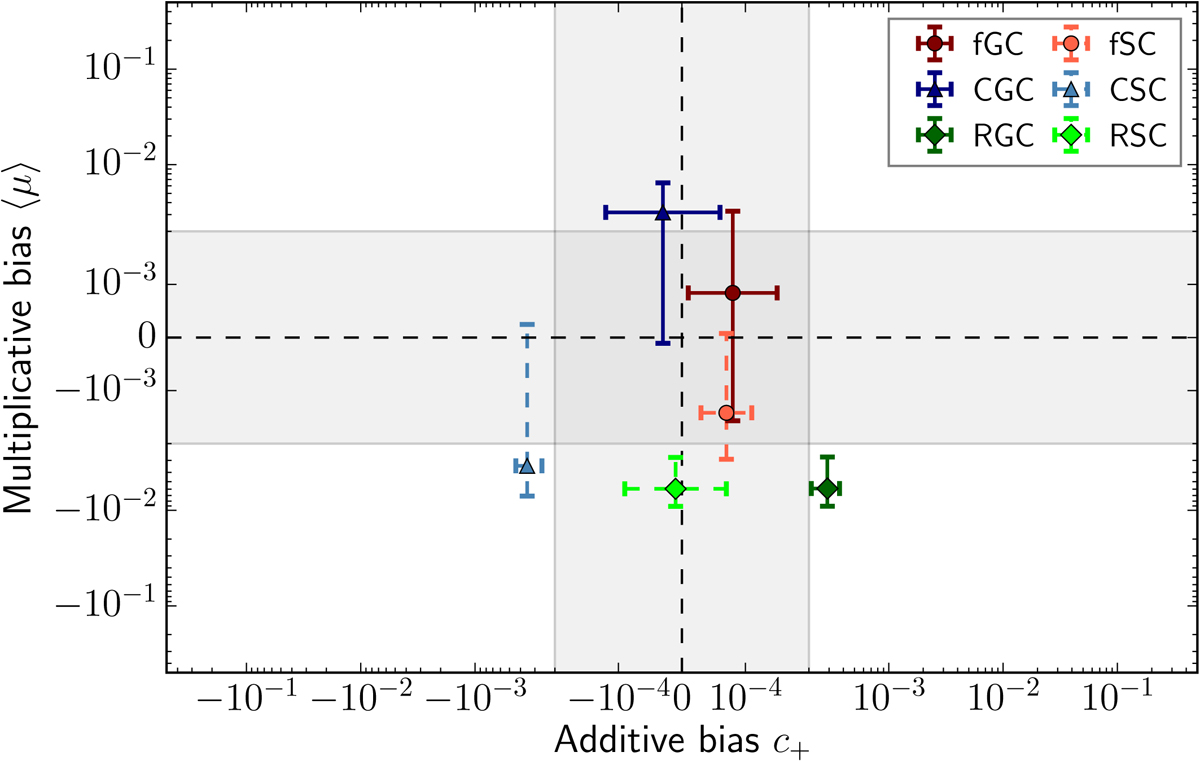
Shear estimation residuals as a function of PSF anisotropy, for the CGC branch of GREAT3. Points show the residuals of the average estimated shear components of the 200 subfields, against the anisotropy of the PSF for the same component. Left panels: residuals of unweighted average shears, right panels: residuals of weighted average shears. For this figure only, we use the distortion e to quantify the anisotropy of the PSF, following Eq. (6) of Mandelbaum et al. (2014). The shaded region covers the same range of residuals in all panels. Its extension, and the axes range of the top right panel is chosen to be directly comparable with Fig. 3 from Huff & Mandelbaum (2017). In the three other panels, the residuals are shown on a linear scale within the shaded area, and using a logarithmic scale outside of this region.
Current usage metrics show cumulative count of Article Views (full-text article views including HTML views, PDF and ePub downloads, according to the available data) and Abstracts Views on Vision4Press platform.
Data correspond to usage on the plateform after 2015. The current usage metrics is available 48-96 hours after online publication and is updated daily on week days.
Initial download of the metrics may take a while.


