Fig. 22.
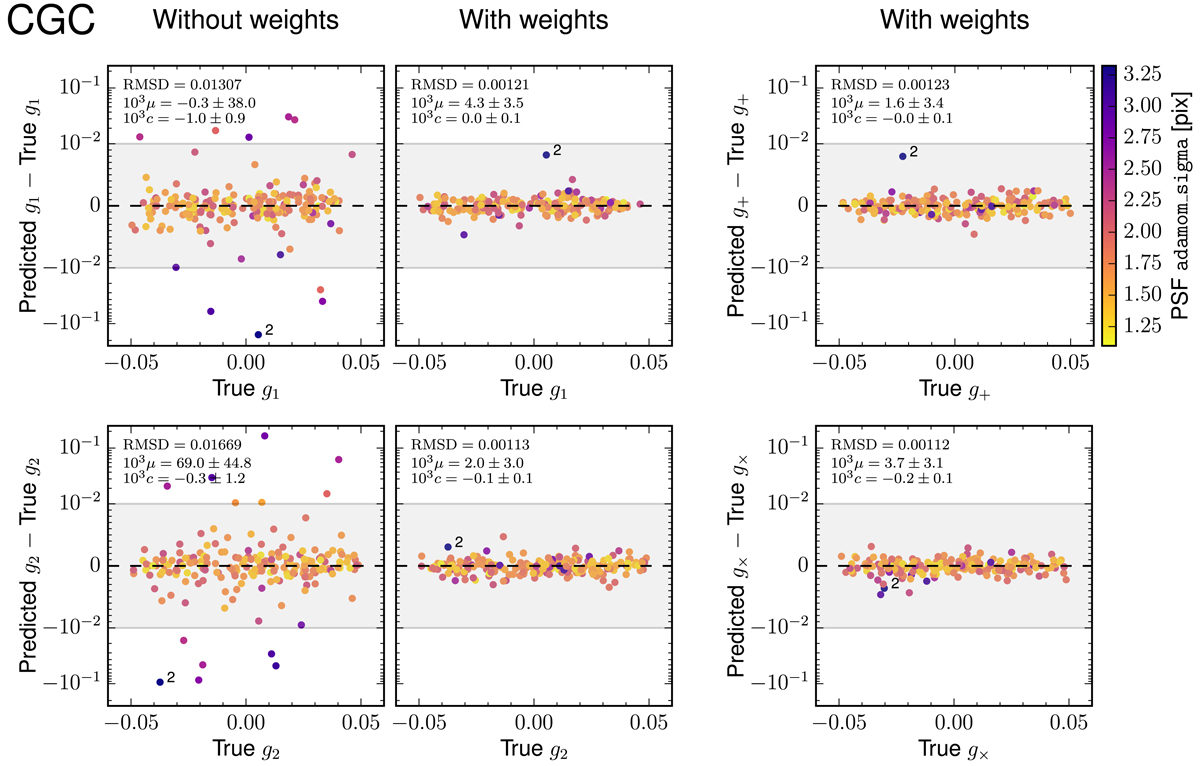
Analysis of the shear estimation errors on the CGC branch of GREAT3. In each panel, points show the residuals of the average estimated shears against the true shears of the 200 subfields. The different panels show different components of the shear, in the frame of the pixel grid (g1 and g2) and in a frame rotated to be aligned with the PSF anisotropy (g+ and g×), as defined in Sect. 2.2. The residuals are shown on a linear scale within the shaded area, and using a logarithmic scale outside of this region. The leftmost panels show residuals of unweighted average shears, i.e., ignoring the weights predicted by the second step of the algorithm. In all panels, colors of the datapoints encode the size of the PSF, with darker colors corresponding to broader PSFs. The infamous subfield labeled “2” has the worst PSF of this GREAT3 branch, with a strong defocus.
Current usage metrics show cumulative count of Article Views (full-text article views including HTML views, PDF and ePub downloads, according to the available data) and Abstracts Views on Vision4Press platform.
Data correspond to usage on the plateform after 2015. The current usage metrics is available 48-96 hours after online publication and is updated daily on week days.
Initial download of the metrics may take a while.