Fig. 21.
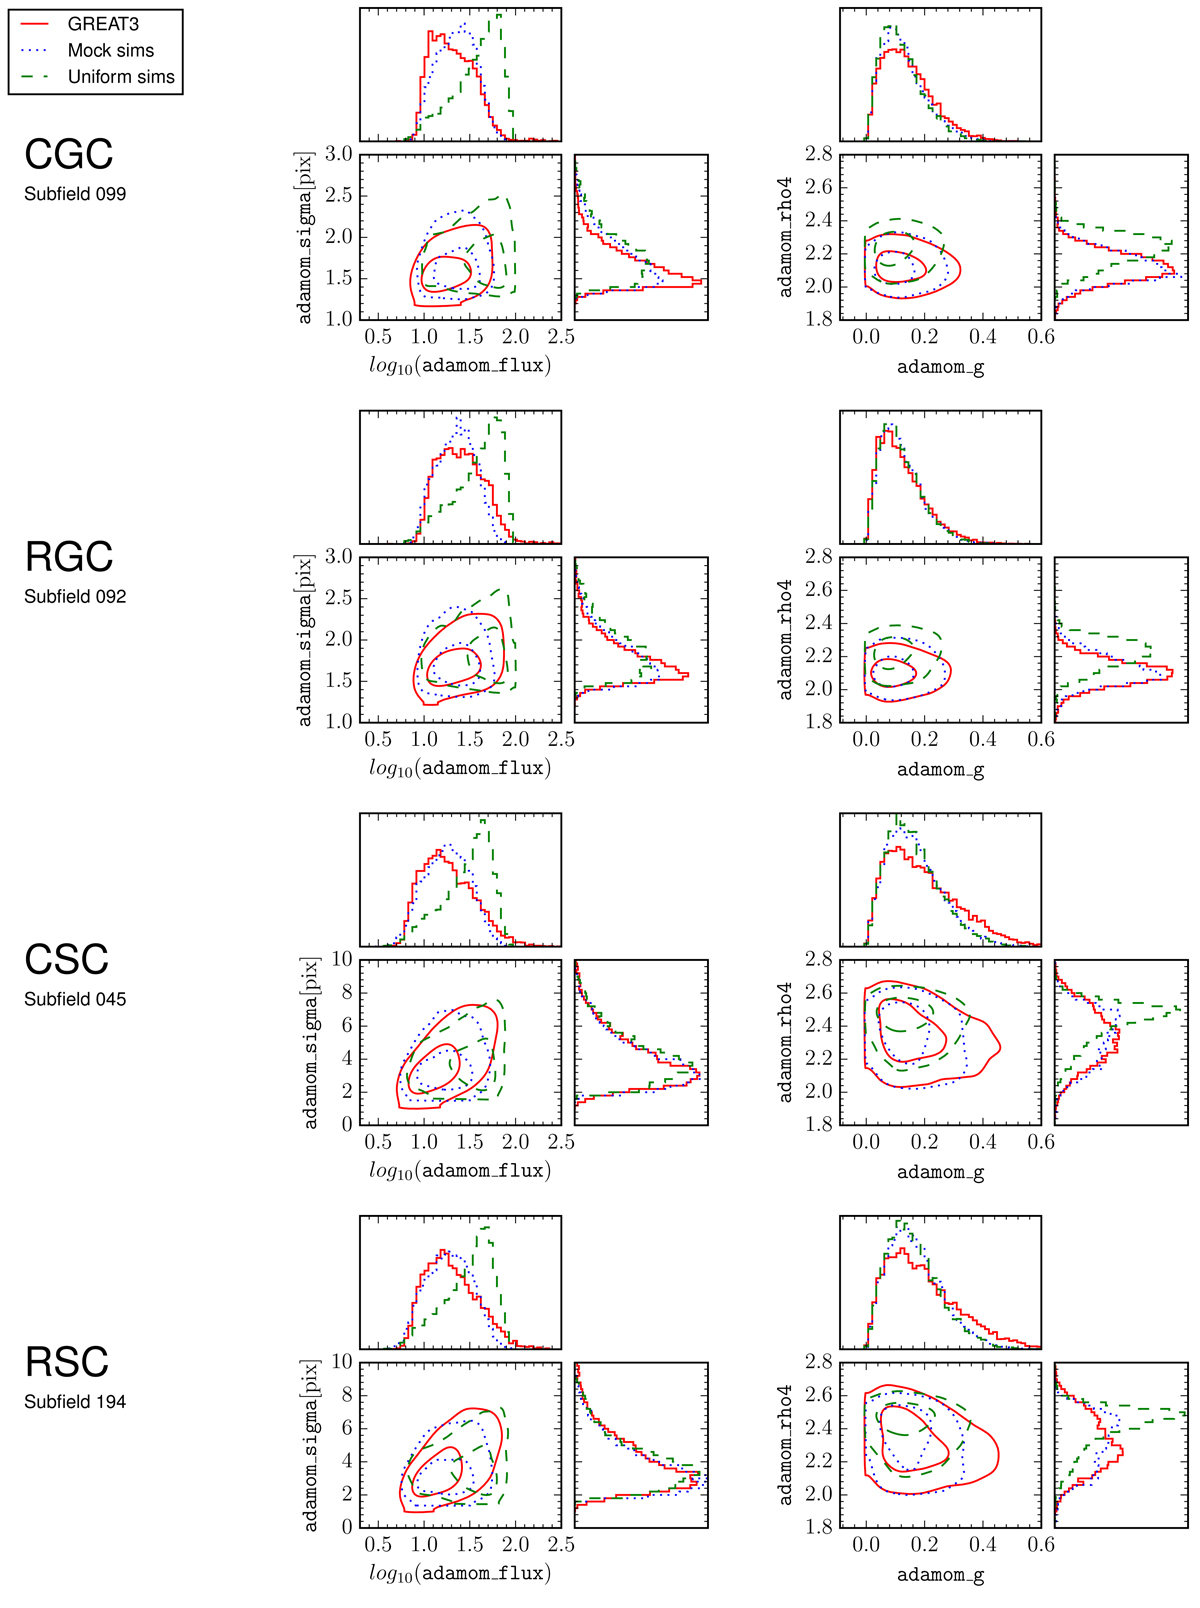
Measured distributions of galaxy features in the GREAT3 data and “mock” and “uniform” simulations, for the subfield with the sharpest PSF in each of the four considered branches. adamom_g denotes the modulus of adamom_g1 + i ⋅ adamom_g2 (as described in Sect. 4.1). Measurements on the GREAT3 data are shown with solid red lines, measurements on the “mock” simulations (using the PSF and noise-level of the corresponding subfield) in dotted blue lines, and measurements on the “uniform” simulations in dashed green.
Current usage metrics show cumulative count of Article Views (full-text article views including HTML views, PDF and ePub downloads, according to the available data) and Abstracts Views on Vision4Press platform.
Data correspond to usage on the plateform after 2015. The current usage metrics is available 48-96 hours after online publication and is updated daily on week days.
Initial download of the metrics may take a while.