Fig. 19.
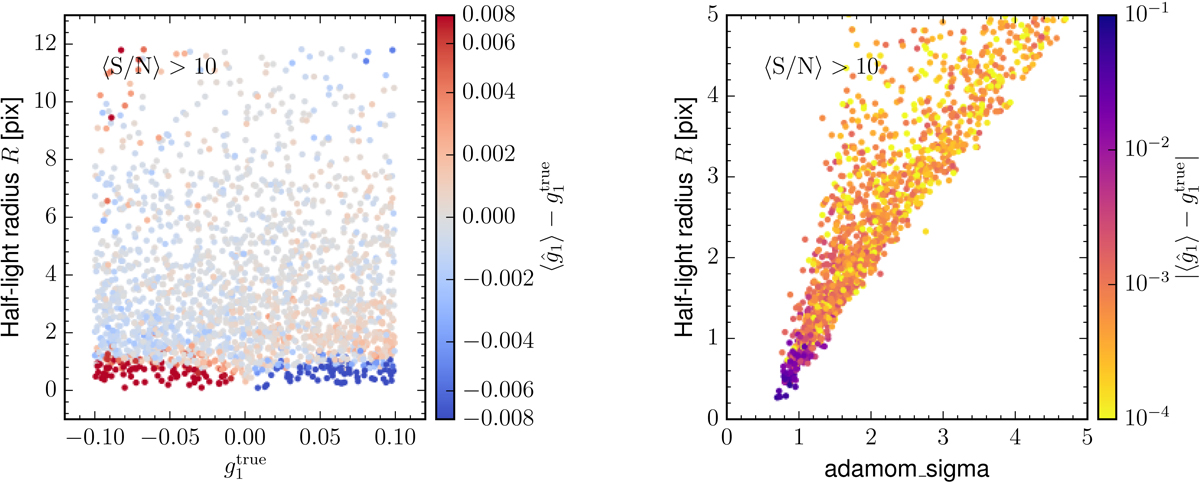
Biases of the point estimates ĝ1 on Euclid-like simulations of galaxies with shape parameters drawn from the GEMS catalog. In both panels, each point represents a case consisting of one particular galaxy, and the shear bias is computed by averaging over 10 000 rotated realizations of this galaxy (the data structure follows Fig. 2). For clarity, only cases with ⟨S/N⟩> 10 are shown. In the right panel, the amplitude of the shear bias is shown as function of half-light radius R and the noisy measured adamom_sigma taken from a single realization of each case.
Current usage metrics show cumulative count of Article Views (full-text article views including HTML views, PDF and ePub downloads, according to the available data) and Abstracts Views on Vision4Press platform.
Data correspond to usage on the plateform after 2015. The current usage metrics is available 48-96 hours after online publication and is updated daily on week days.
Initial download of the metrics may take a while.