Free Access
Fig. 10.
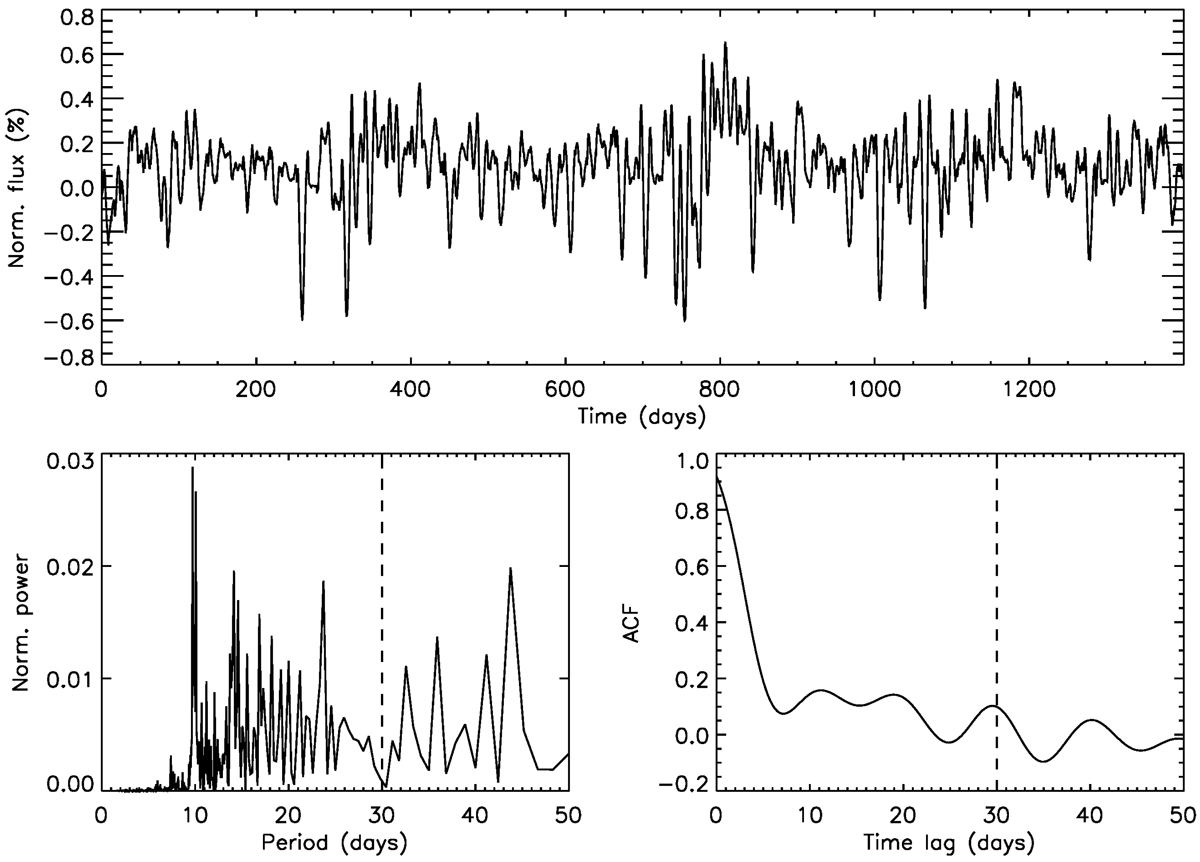
Top panel: model light curve with a rotation period of 30 days viewed at an inclination angle of 90°. Lower left: Lomb-Scargle periodogram of the time series. Lower right: auto-correlation function of the time series. The vertical dashed line indicates the model rotation period.
Current usage metrics show cumulative count of Article Views (full-text article views including HTML views, PDF and ePub downloads, according to the available data) and Abstracts Views on Vision4Press platform.
Data correspond to usage on the plateform after 2015. The current usage metrics is available 48-96 hours after online publication and is updated daily on week days.
Initial download of the metrics may take a while.