Open Access
Fig. A.1.
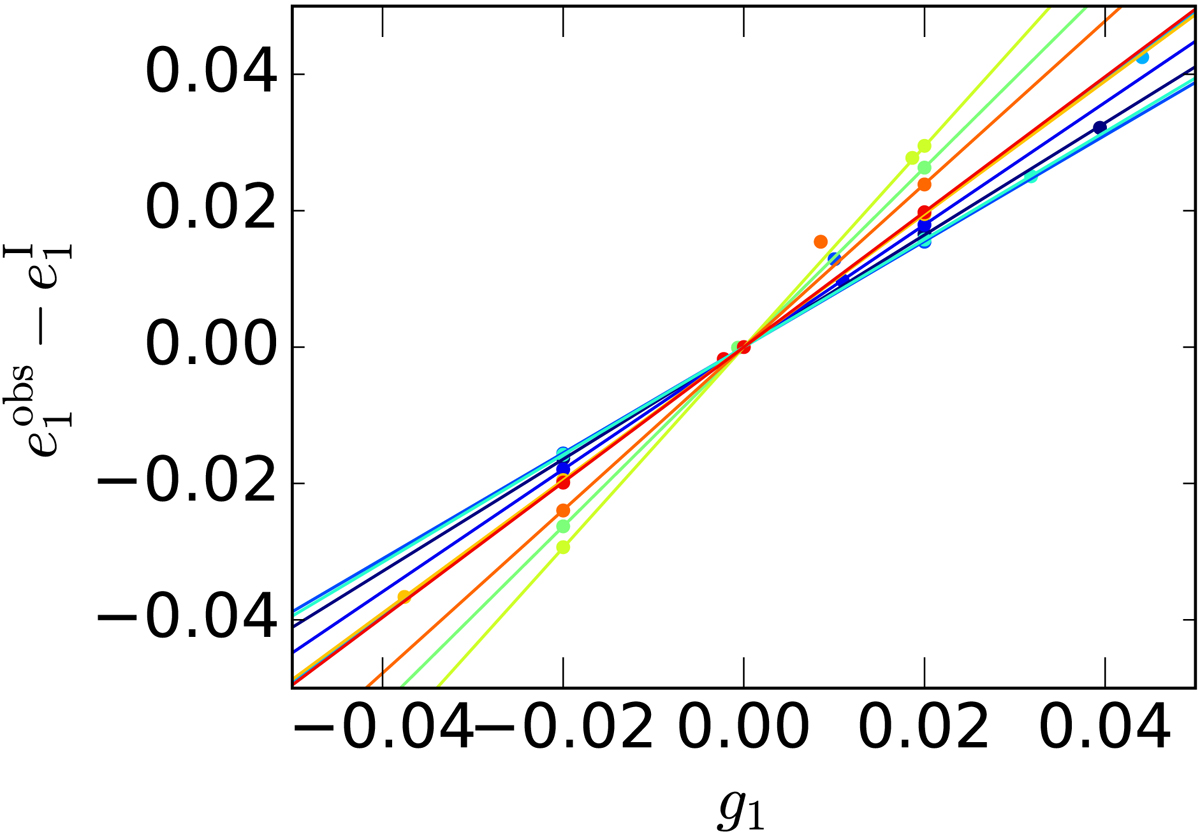
Illustration of the shear response estimations with different shear values used for ten image examples. Each colour represents a different image, and the points show the observed ellipticities obtained with different shear values. The solid lines show ![]() for each case.
for each case.
Current usage metrics show cumulative count of Article Views (full-text article views including HTML views, PDF and ePub downloads, according to the available data) and Abstracts Views on Vision4Press platform.
Data correspond to usage on the plateform after 2015. The current usage metrics is available 48-96 hours after online publication and is updated daily on week days.
Initial download of the metrics may take a while.