Fig. 7.
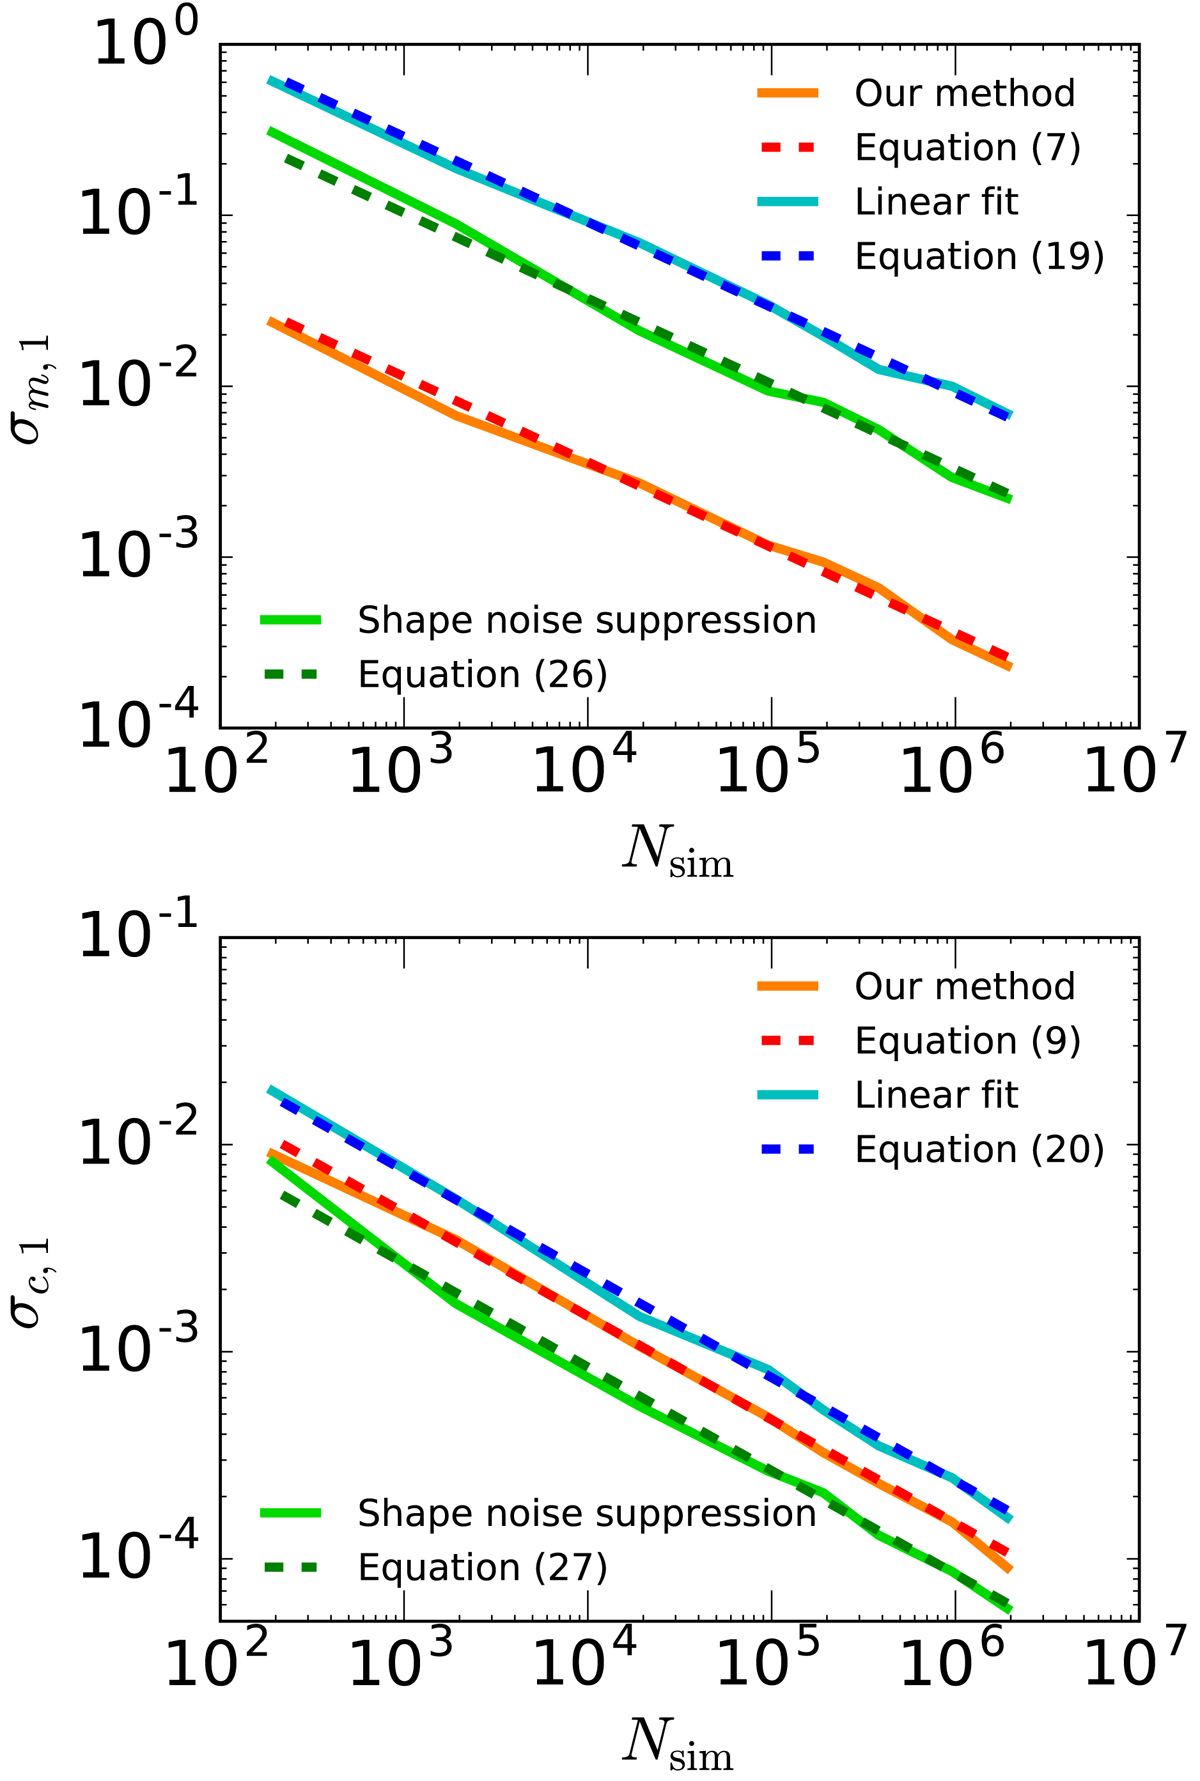
rms of the multiplicative (top panel) and additive (bottom panel) shear bias. We compare our method (red/orange lines) to the linear fit with (green) and without (cyan/blue) shape-noise suppression. The solid lines are measurements from the numerical simulations. Dashed lines show the analytical predictions derived in Sect. 4.
Current usage metrics show cumulative count of Article Views (full-text article views including HTML views, PDF and ePub downloads, according to the available data) and Abstracts Views on Vision4Press platform.
Data correspond to usage on the plateform after 2015. The current usage metrics is available 48-96 hours after online publication and is updated daily on week days.
Initial download of the metrics may take a while.