Fig. 6.
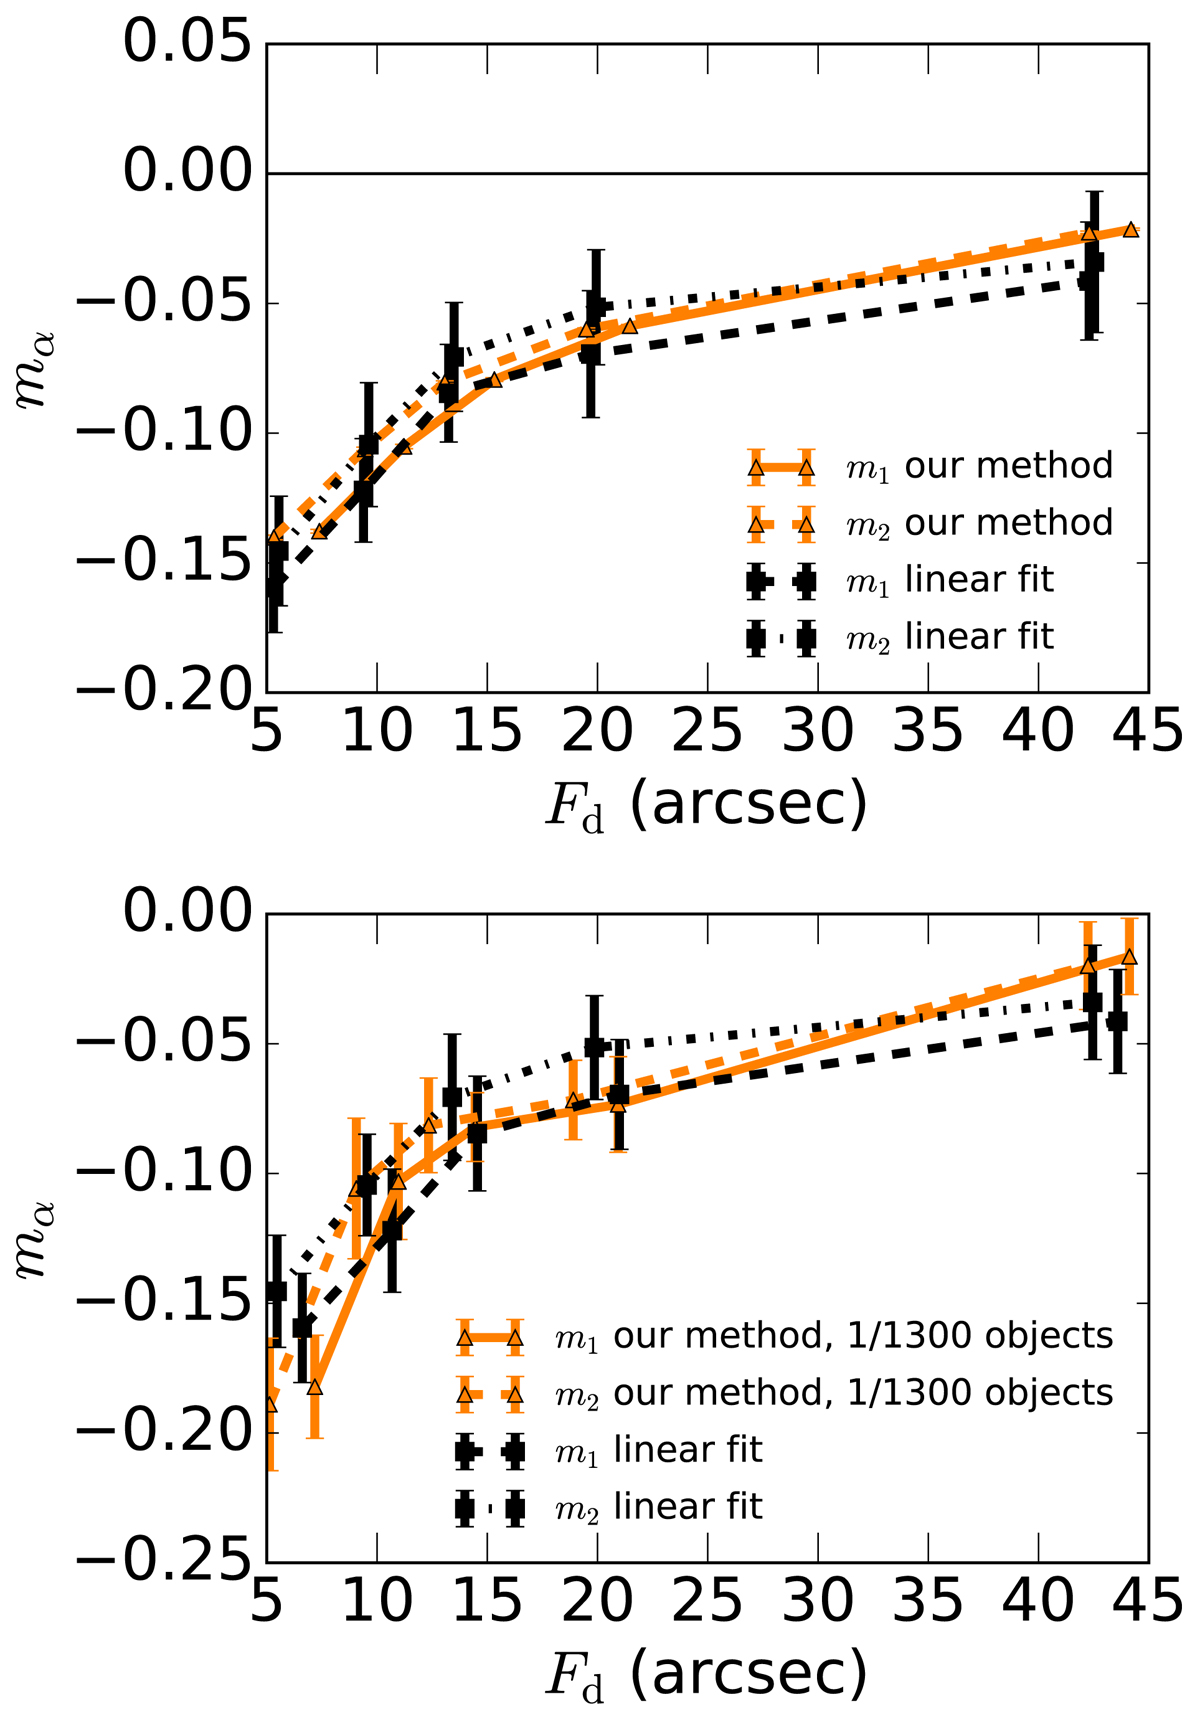
Multiplicative shear bias as a function of the disk flux Fd, measured with our method (black lines) and (in orange) from the linear fit to Eq. (1). Solid (dashed) lines correspond to m1 (m2). The top panel shows the results using the same number of object for both methods. In the bottom panel, only 1/1300 objects have been used for our method.
Current usage metrics show cumulative count of Article Views (full-text article views including HTML views, PDF and ePub downloads, according to the available data) and Abstracts Views on Vision4Press platform.
Data correspond to usage on the plateform after 2015. The current usage metrics is available 48-96 hours after online publication and is updated daily on week days.
Initial download of the metrics may take a while.