Fig. 2.
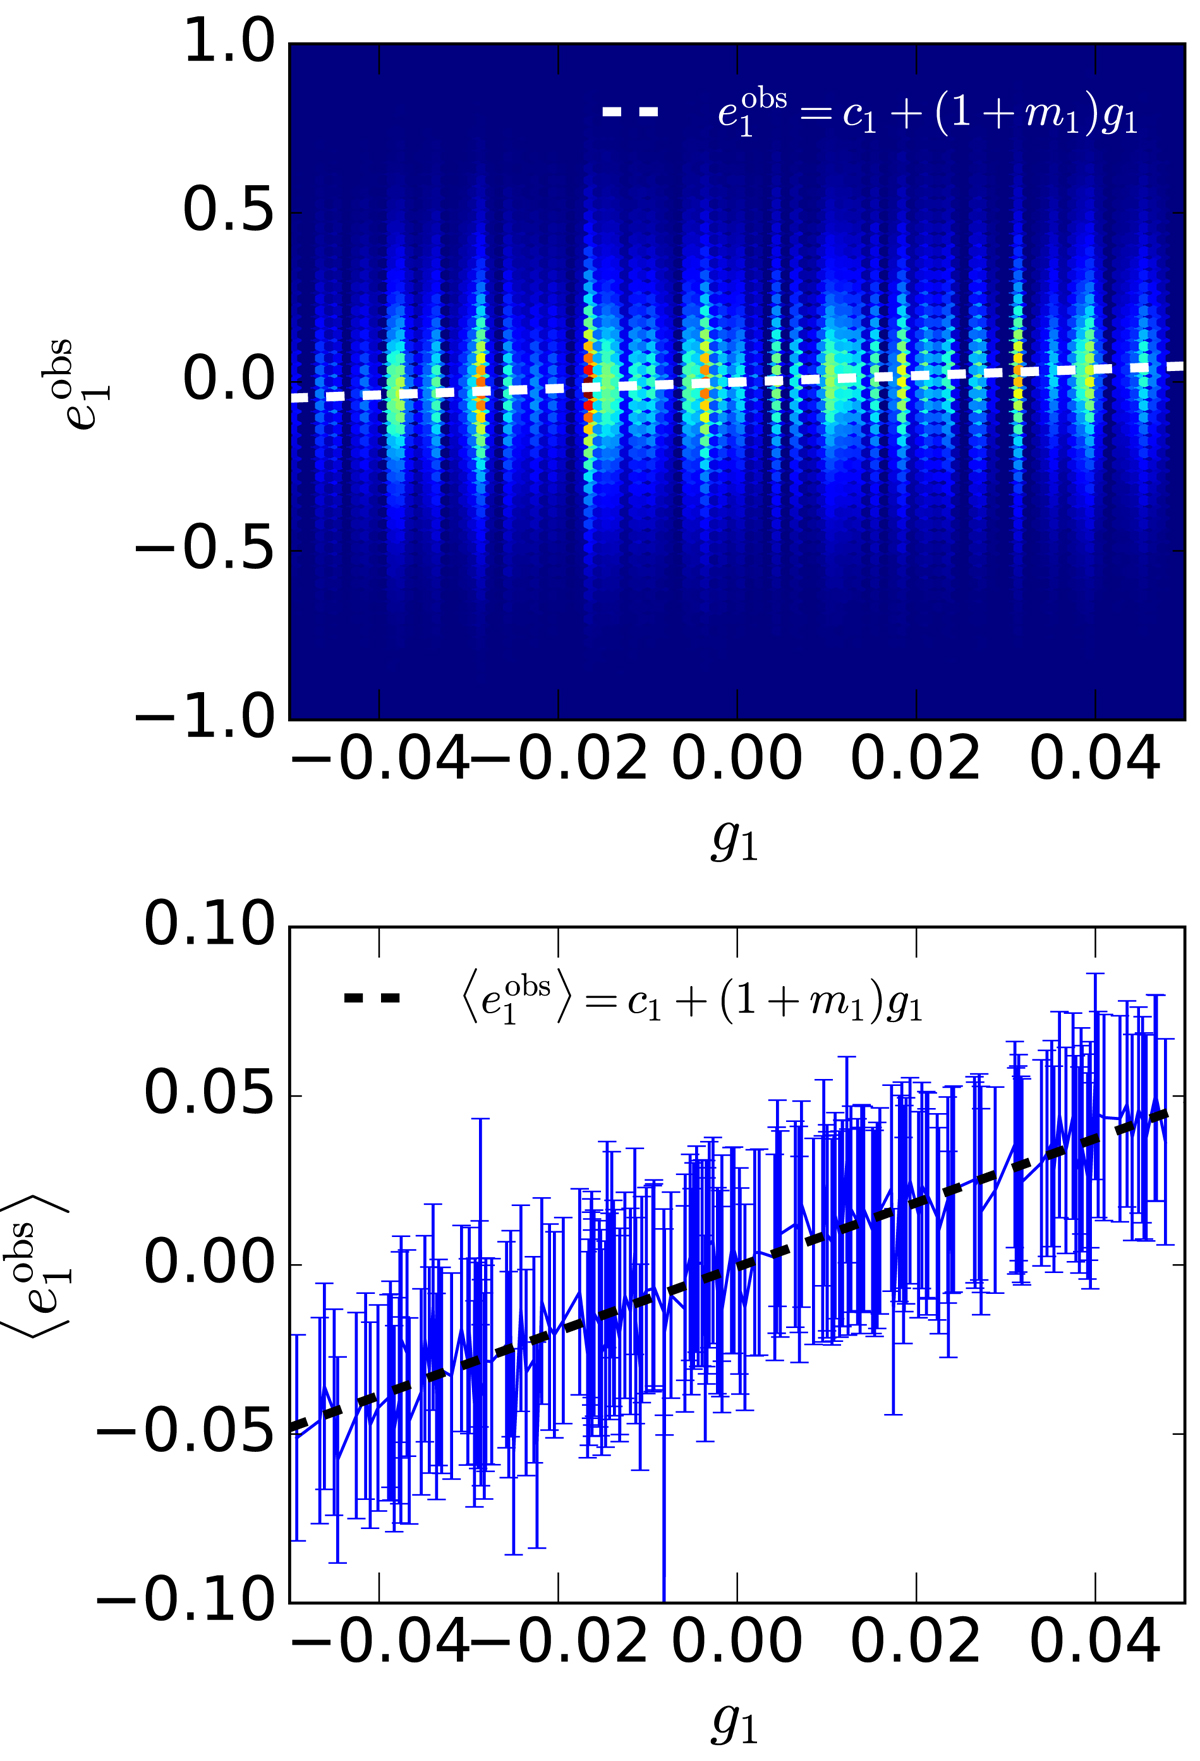
Scheme of the estimation of biases m1 and c1 from the linear fit of the distribution of ![]() as a function of g1. In the top panel, the white dashed line shows the linear fit of the distribution, represented by the colour map. In the bottom panel, the blue points and error bars show the mean
as a function of g1. In the top panel, the white dashed line shows the linear fit of the distribution, represented by the colour map. In the bottom panel, the blue points and error bars show the mean ![]() of the galaxies with the same shear. The black dashed line shows the weighted linear fit of the blue points.
of the galaxies with the same shear. The black dashed line shows the weighted linear fit of the blue points.
Current usage metrics show cumulative count of Article Views (full-text article views including HTML views, PDF and ePub downloads, according to the available data) and Abstracts Views on Vision4Press platform.
Data correspond to usage on the plateform after 2015. The current usage metrics is available 48-96 hours after online publication and is updated daily on week days.
Initial download of the metrics may take a while.