Fig. 9.
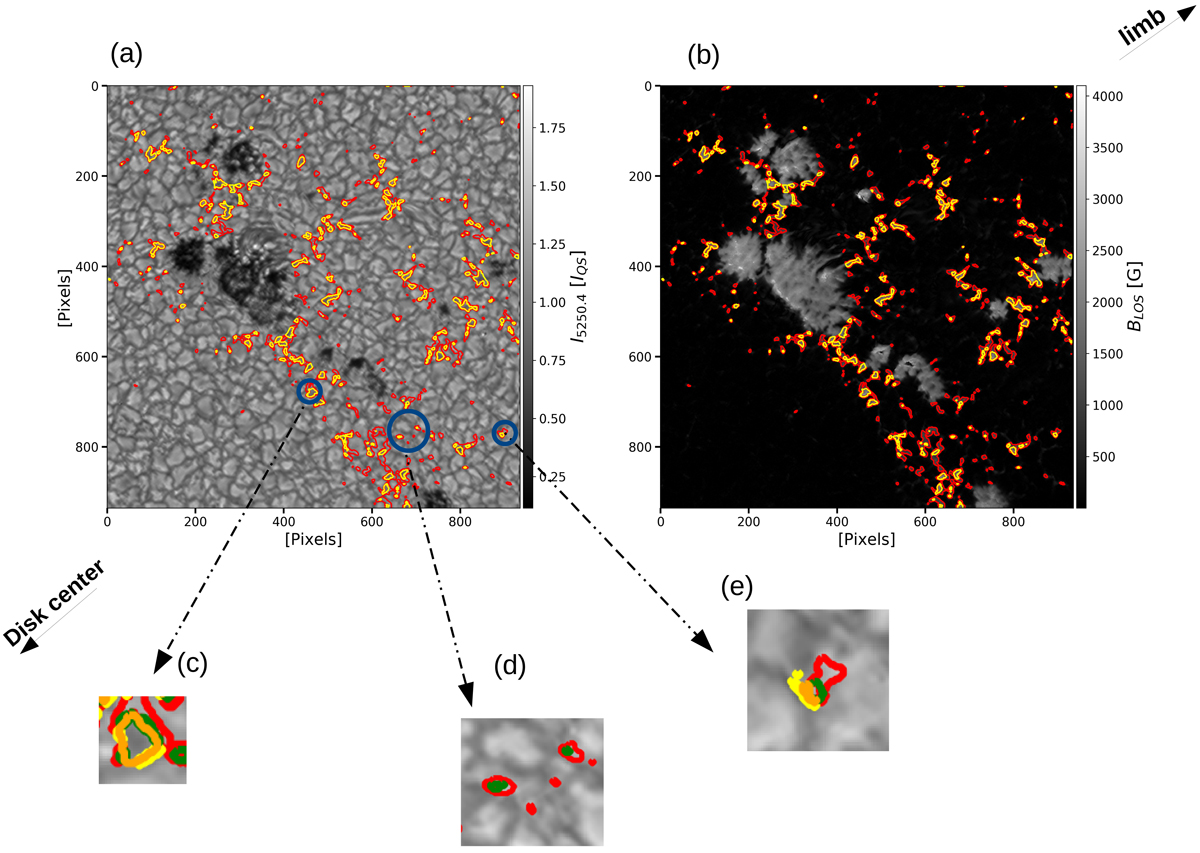
Panels a and b: IMaX data for the same time as in Fig. 1, now with the absolute value of BLOS plotted in the right panel. The red contours enclose the “peak” pixels with > 1 averaged contrast in the continuum of 525 nm and 600 G < BLOS < 1000 G, while the yellow contours enclose the “turnover” pixels with averaged contrasts < 1 and BLOS larger than 1200 G. Panels c, d, e: blowups of three magnetic features of different sizes. Red and green contours enclose the bright (contrast > 1) parts of both families of pixels, while orange and yellow contours enclose the dark (contrast < 1) parts.
Current usage metrics show cumulative count of Article Views (full-text article views including HTML views, PDF and ePub downloads, according to the available data) and Abstracts Views on Vision4Press platform.
Data correspond to usage on the plateform after 2015. The current usage metrics is available 48-96 hours after online publication and is updated daily on week days.
Initial download of the metrics may take a while.