Free Access
Fig. 7.
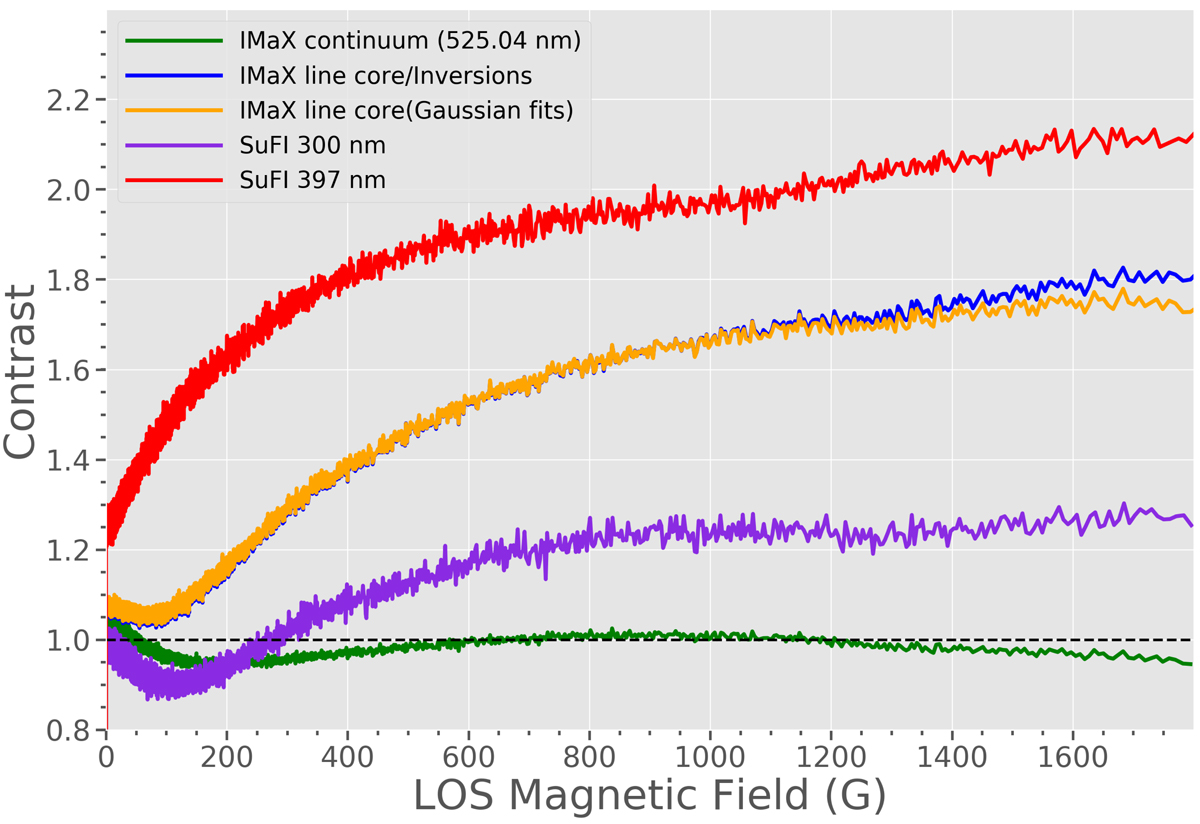
Intensity contrasts of plage vs. BLOS in the wavelengths considered in the current study (see the legend in the figure). Plotted are the contrast values (plotted in red in Figs. 3–6). For comparison, also plotted is the binned line-core contrast at 525.02 nm derived from Gaussian fits to individual Stokes I profiles.
Current usage metrics show cumulative count of Article Views (full-text article views including HTML views, PDF and ePub downloads, according to the available data) and Abstracts Views on Vision4Press platform.
Data correspond to usage on the plateform after 2015. The current usage metrics is available 48-96 hours after online publication and is updated daily on week days.
Initial download of the metrics may take a while.