Free Access
Fig. 5.
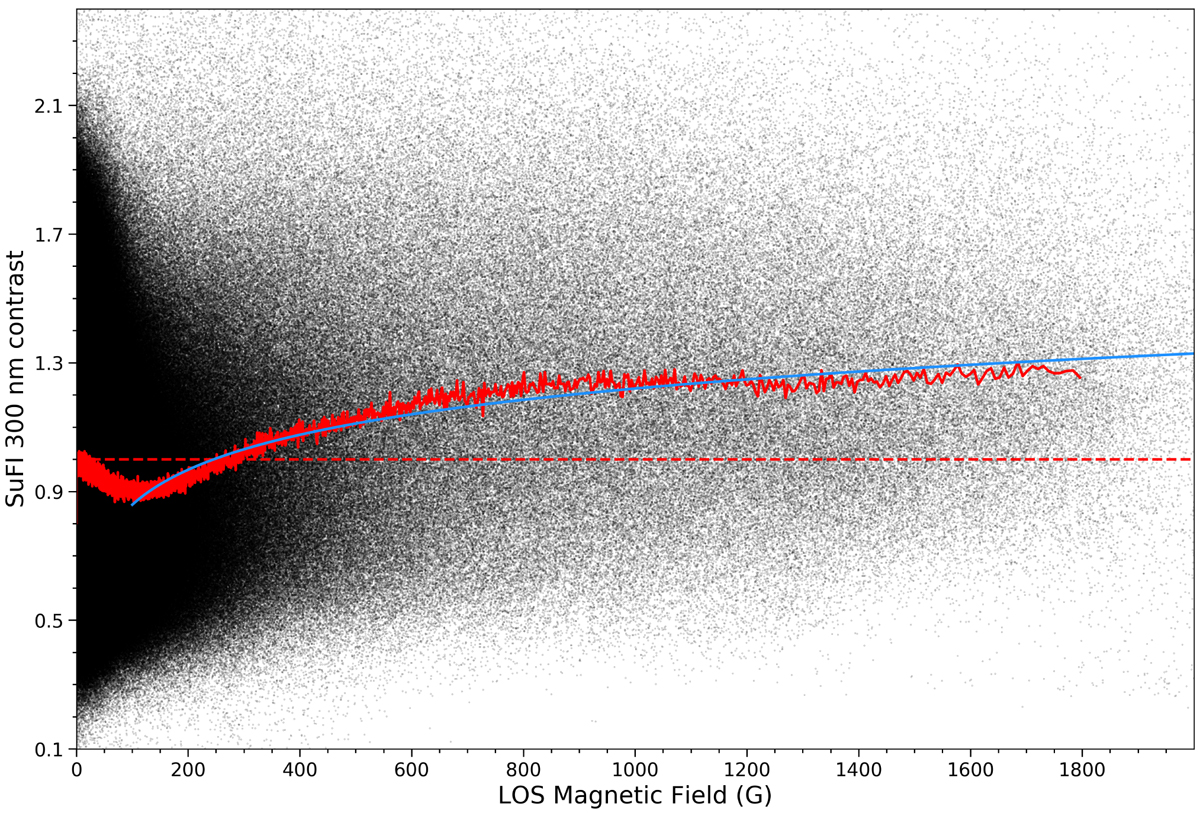
Scatterplot of the SuFI intensity contrast at 300 nm vs. BLOS. The red curve joins the averaged contrast values inside each bin, the blue curve is the logarithmic fit to the red curve starting from 100 G.
Current usage metrics show cumulative count of Article Views (full-text article views including HTML views, PDF and ePub downloads, according to the available data) and Abstracts Views on Vision4Press platform.
Data correspond to usage on the plateform after 2015. The current usage metrics is available 48-96 hours after online publication and is updated daily on week days.
Initial download of the metrics may take a while.