Fig. 2.
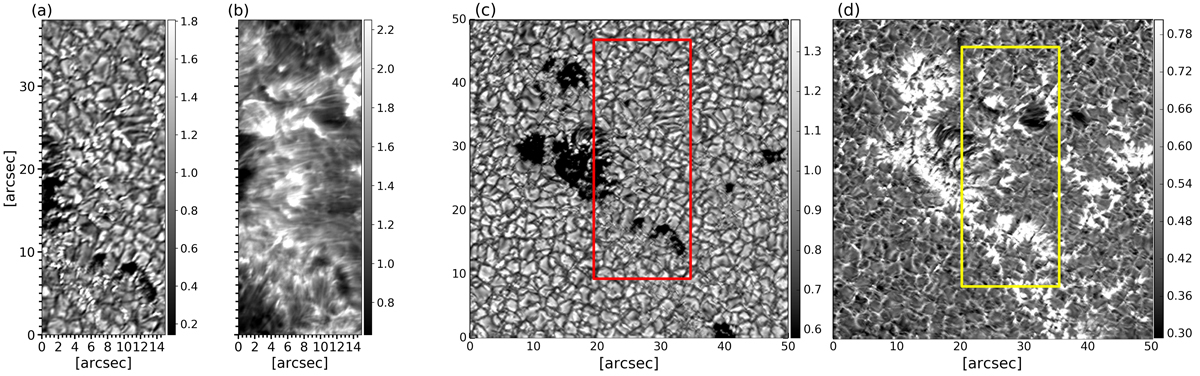
SuFI images coaligned to the IMaX FOV shown in Fig. 1. Panel a: SuFI 300 nm. Panel b: SuFI Ca II H. Panel c: IMaX continuum intensity (normalized to the mean quiet-Sun intensity) to which SuFI 300 nm (overlaid in red) is aligned. Panel d: IMaX line-core intensity derived from the inversions (see Sect. 2.5) and normalized to the local continuum (I+227), and to which calcium images (overlaid in yellow) are aligned. The yellow and red boxes are slightly misaligned due to the differential offsets in the SuFI wavelegnth channels. The gray scale is set to cover two times the rms range of each image.
Current usage metrics show cumulative count of Article Views (full-text article views including HTML views, PDF and ePub downloads, according to the available data) and Abstracts Views on Vision4Press platform.
Data correspond to usage on the plateform after 2015. The current usage metrics is available 48-96 hours after online publication and is updated daily on week days.
Initial download of the metrics may take a while.