Fig. 13.
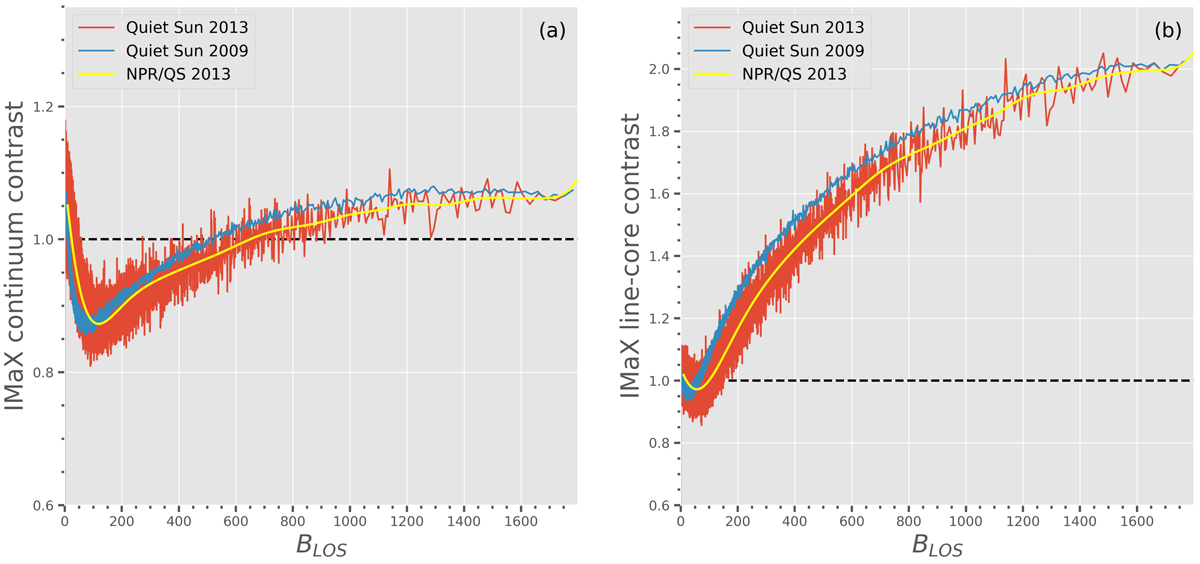
IMaX continuum (panel a) and line-core (panel b) contrasts vs. BLOS. The red curves are the binned contrasts of quiet-Sun areas extracted from the 2013 ARs scans, and the blue curves are taken from Paper I for quiet-Sun observations in 2009. The yellow curves are the result of non-parametric smoothing applied to the scattered data points of quiet-Sun pixels of 2013. The black dashed line is the quiet-Sun level where contrast is equal to unity.
Current usage metrics show cumulative count of Article Views (full-text article views including HTML views, PDF and ePub downloads, according to the available data) and Abstracts Views on Vision4Press platform.
Data correspond to usage on the plateform after 2015. The current usage metrics is available 48-96 hours after online publication and is updated daily on week days.
Initial download of the metrics may take a while.