Free Access
Fig. 12.
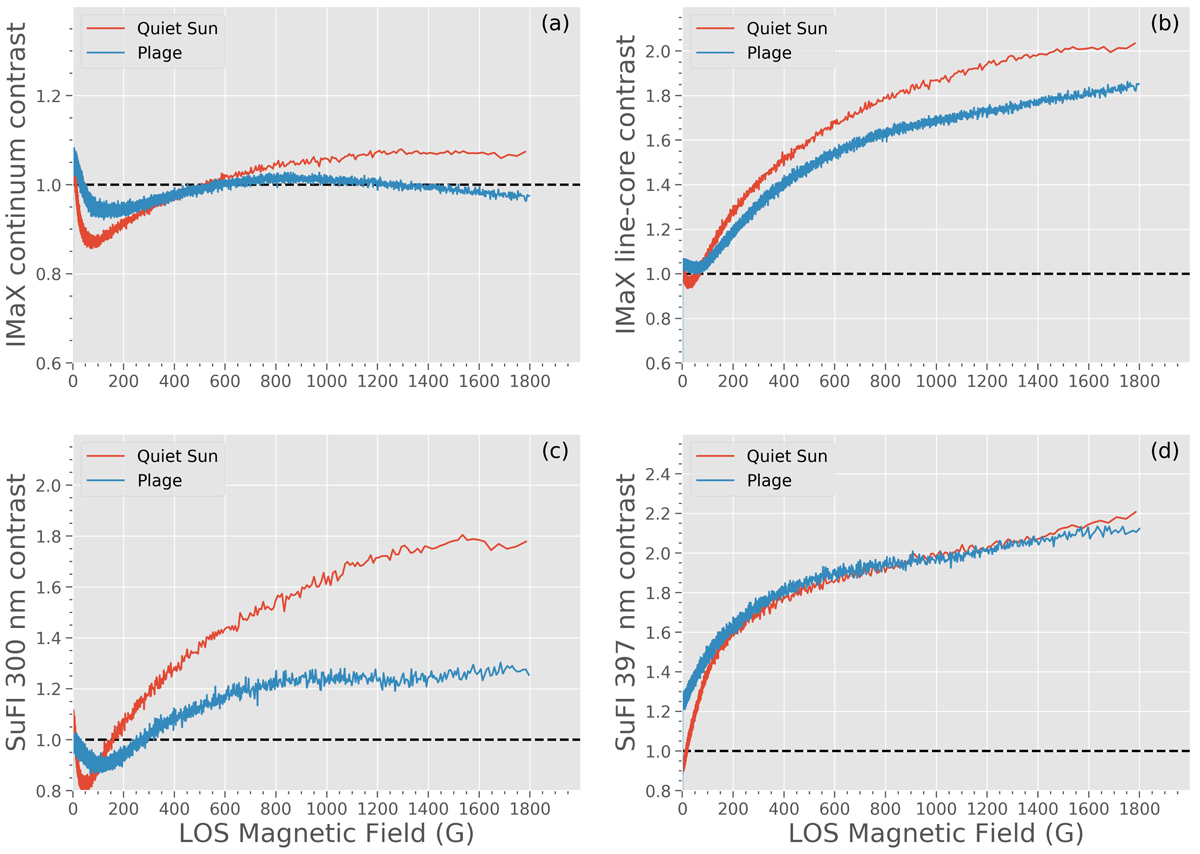
Averaged contrast of IMaX continuum (panel a), IMaX line core (panel b), SuFI 300 nm (panel c), SuFI 397 nm (panel d) against BLOS for the quiet Sun observed by SUNRISE in 2009 (blue curves) and for plage (red curves) in 2013.
Current usage metrics show cumulative count of Article Views (full-text article views including HTML views, PDF and ePub downloads, according to the available data) and Abstracts Views on Vision4Press platform.
Data correspond to usage on the plateform after 2015. The current usage metrics is available 48-96 hours after online publication and is updated daily on week days.
Initial download of the metrics may take a while.