Fig. 11.
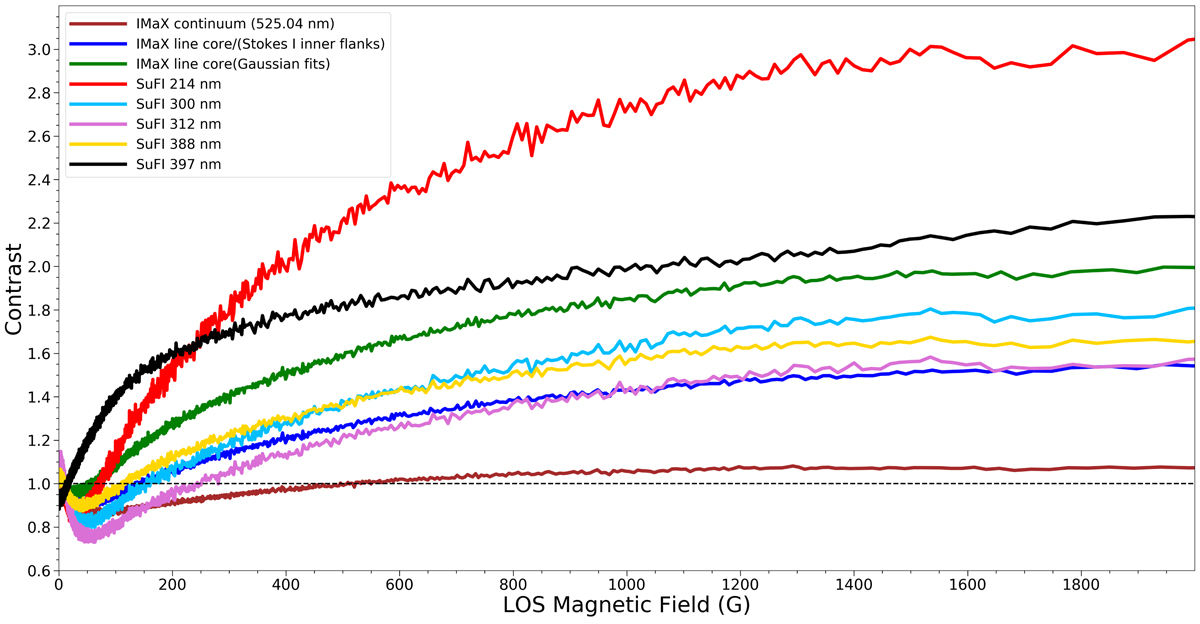
All binned contrast vs. BLOS curves from Figs. 3, 4, 7 and 8 of Paper I plotted together. Also plotted is the contrast of the 5250 Å line core obtained by averaging the intensities at the wavelength positions +40 and −40 mÅ from line core. The curves are identified by their color in the legend in the upper left part of the figure. The black dashed line marks the mean quiet-Sun intensity level, i.e., a contrast of unity.
Current usage metrics show cumulative count of Article Views (full-text article views including HTML views, PDF and ePub downloads, according to the available data) and Abstracts Views on Vision4Press platform.
Data correspond to usage on the plateform after 2015. The current usage metrics is available 48-96 hours after online publication and is updated daily on week days.
Initial download of the metrics may take a while.