Fig. 10.
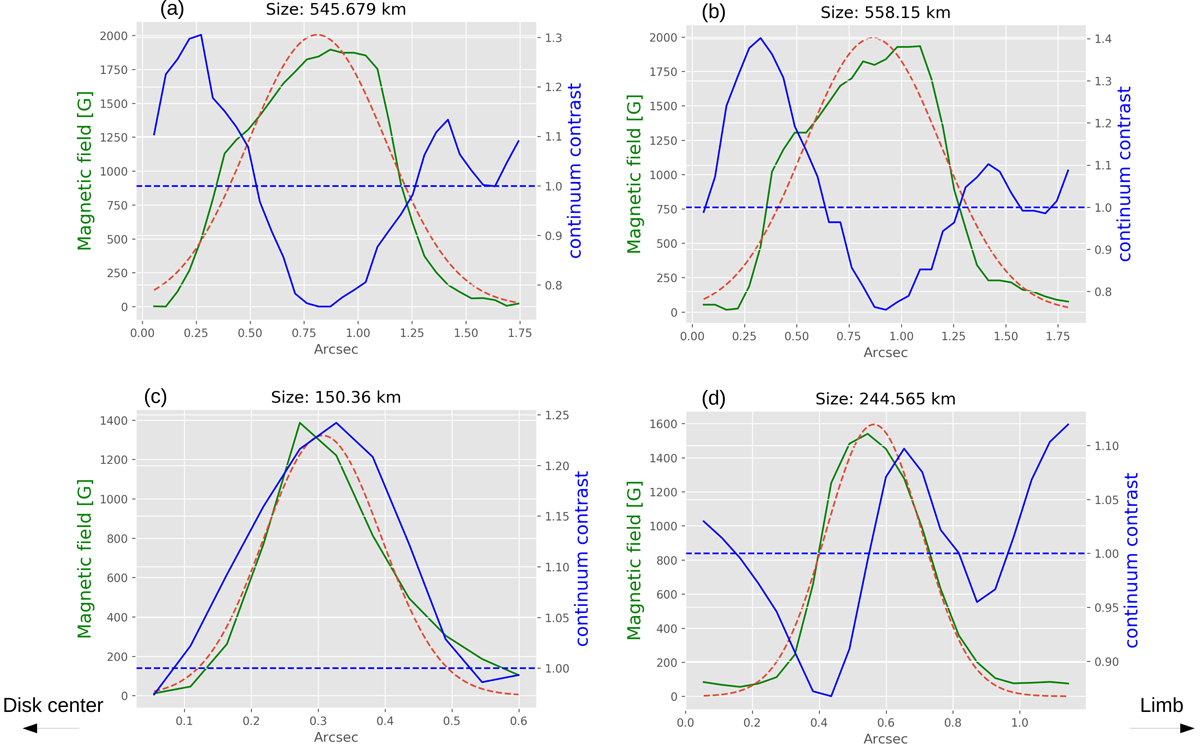
Profiles of BLOS (green curve) and continuum intensity contrast at 525 nm (blue curve) along cuts through four different magnetic structures in an example IMaX image (see text for details). The red dashed curves are the Gaussian fits to the BLOS profiles. The FWHM of these Gaussian fits are given at the top of each frame. The horizontal dashed blue line is where the contrast is equal to unity. The limb is to the right of the figure, while disk center is to the left
Current usage metrics show cumulative count of Article Views (full-text article views including HTML views, PDF and ePub downloads, according to the available data) and Abstracts Views on Vision4Press platform.
Data correspond to usage on the plateform after 2015. The current usage metrics is available 48-96 hours after online publication and is updated daily on week days.
Initial download of the metrics may take a while.