Fig. 1.
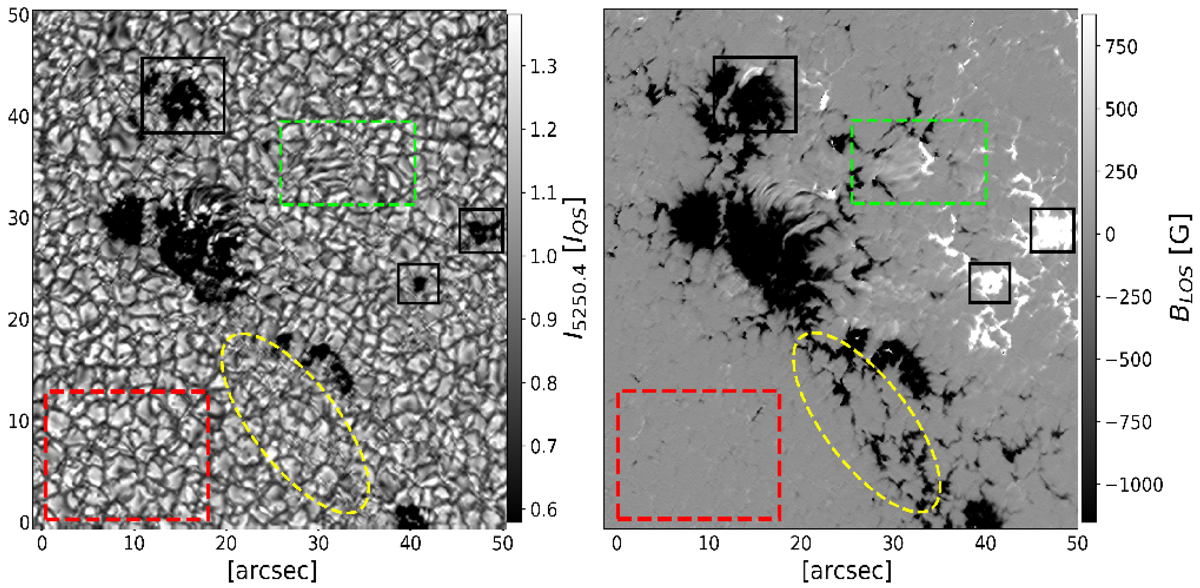
Left panel: continuum contrast at 525 nm. Right panel: its co-spatial and co-temporal longitudinal magnetic field map retrieved from the inversions. The black boxes (solid lines) contain small pores characterized by contrast below unity and kG magnetic fields. The dashed green box encloses an area with emerging flux. The dashed yellow ellipse outlines a region of plage composed of magnetic elements embedded in intergranular lanes. The dashed red box contains a quiet-Sun internetwork region with weak fields (average of 20 G) and mean contrast of unity (by definition).
Current usage metrics show cumulative count of Article Views (full-text article views including HTML views, PDF and ePub downloads, according to the available data) and Abstracts Views on Vision4Press platform.
Data correspond to usage on the plateform after 2015. The current usage metrics is available 48-96 hours after online publication and is updated daily on week days.
Initial download of the metrics may take a while.