Fig. 9.
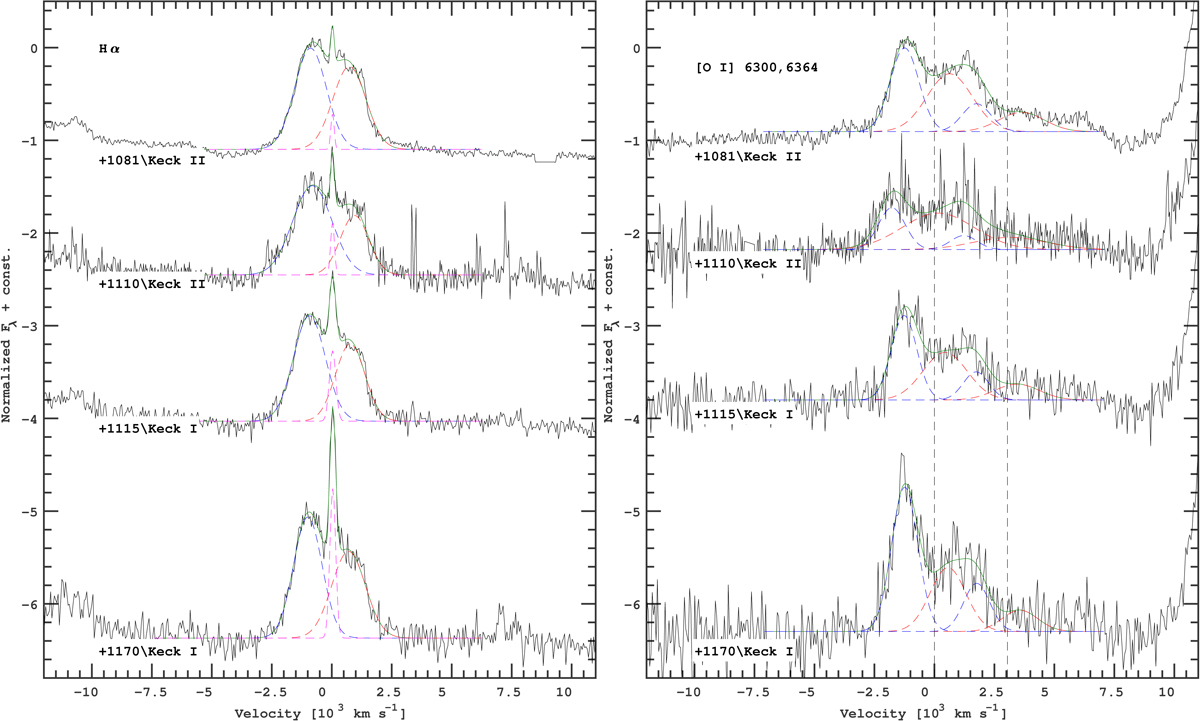
As in Fig. 7, but here the four highest signal-to-noise ratio late-time spectra are plotted around the wavelength range of Hα (left panel) and [O I] λλ6300, 6364 (right panel). For Hα, a triple Gaussian fit (green line for the total fit; blue, red, and magenta for the single components) is performed to discuss the late-time asymmetry of the line. For [O I] λλ6300, 6364, we used two Gaussians (a blueshifted and a redshifted component) for each of the two lines (6300 and 6364 Å). The normalisation of the two lines was fixed so that the 6300 Å line has three times the flux of the 6364 Å line. The centroids of the corresponding components of the two lines were fixed to be 64 Å apart.
Current usage metrics show cumulative count of Article Views (full-text article views including HTML views, PDF and ePub downloads, according to the available data) and Abstracts Views on Vision4Press platform.
Data correspond to usage on the plateform after 2015. The current usage metrics is available 48-96 hours after online publication and is updated daily on week days.
Initial download of the metrics may take a while.