Free Access
Fig. 6.
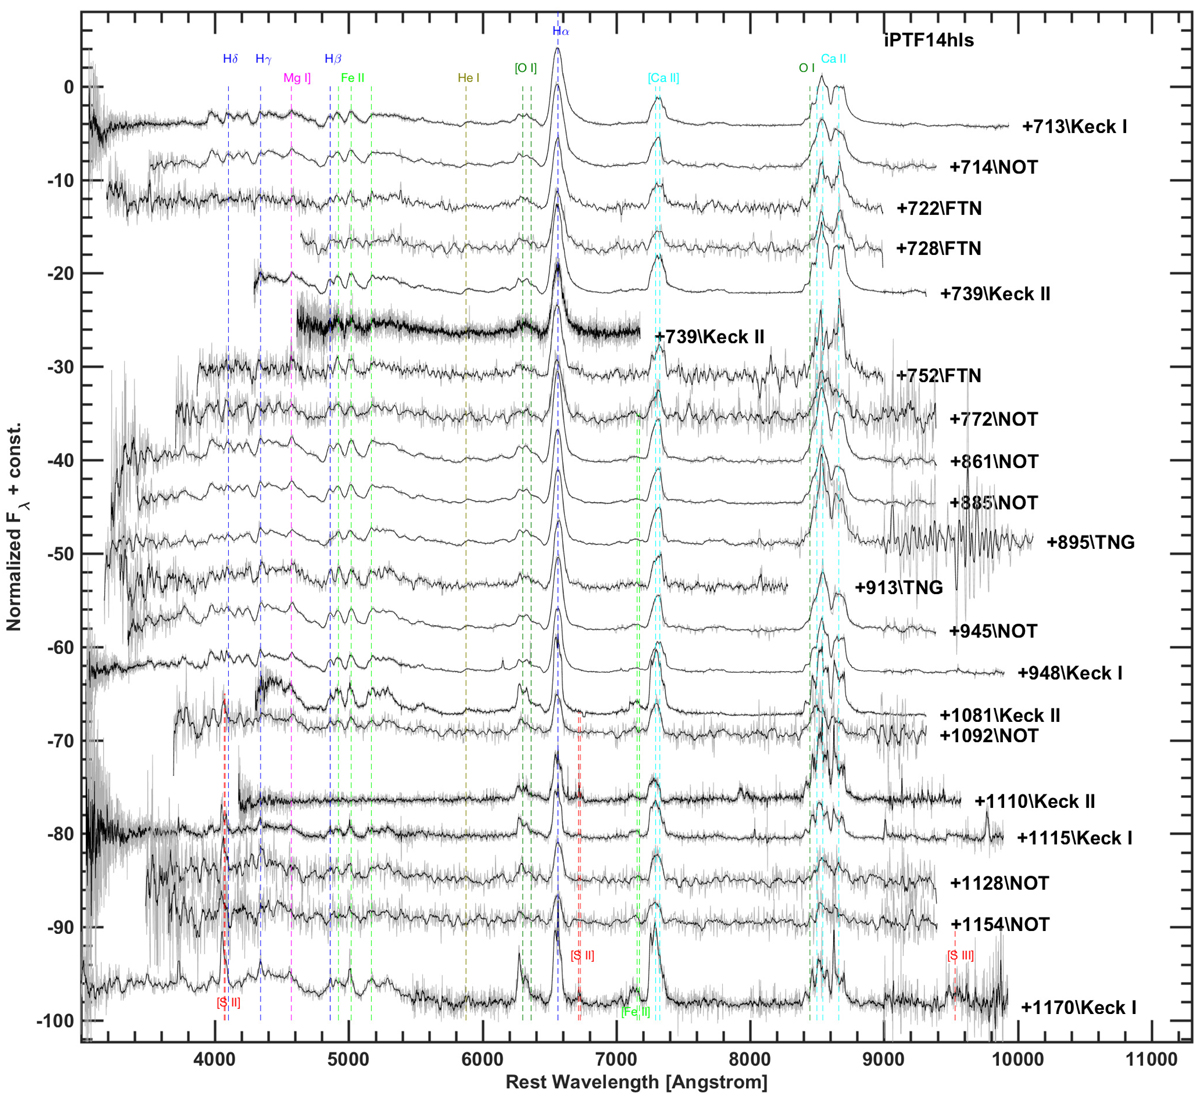
Late-time (> 700 d) spectral sequence of iPTF14hls. The SN went into the fully nebular phase during this period. Some of the main features are labelled and marked by coloured dashed lines at their rest wavelengths. The rest-frame phases are indicated next to the spectra. The spectra have been offset in flux for clarity.
Current usage metrics show cumulative count of Article Views (full-text article views including HTML views, PDF and ePub downloads, according to the available data) and Abstracts Views on Vision4Press platform.
Data correspond to usage on the plateform after 2015. The current usage metrics is available 48-96 hours after online publication and is updated daily on week days.
Initial download of the metrics may take a while.