Fig. 5.
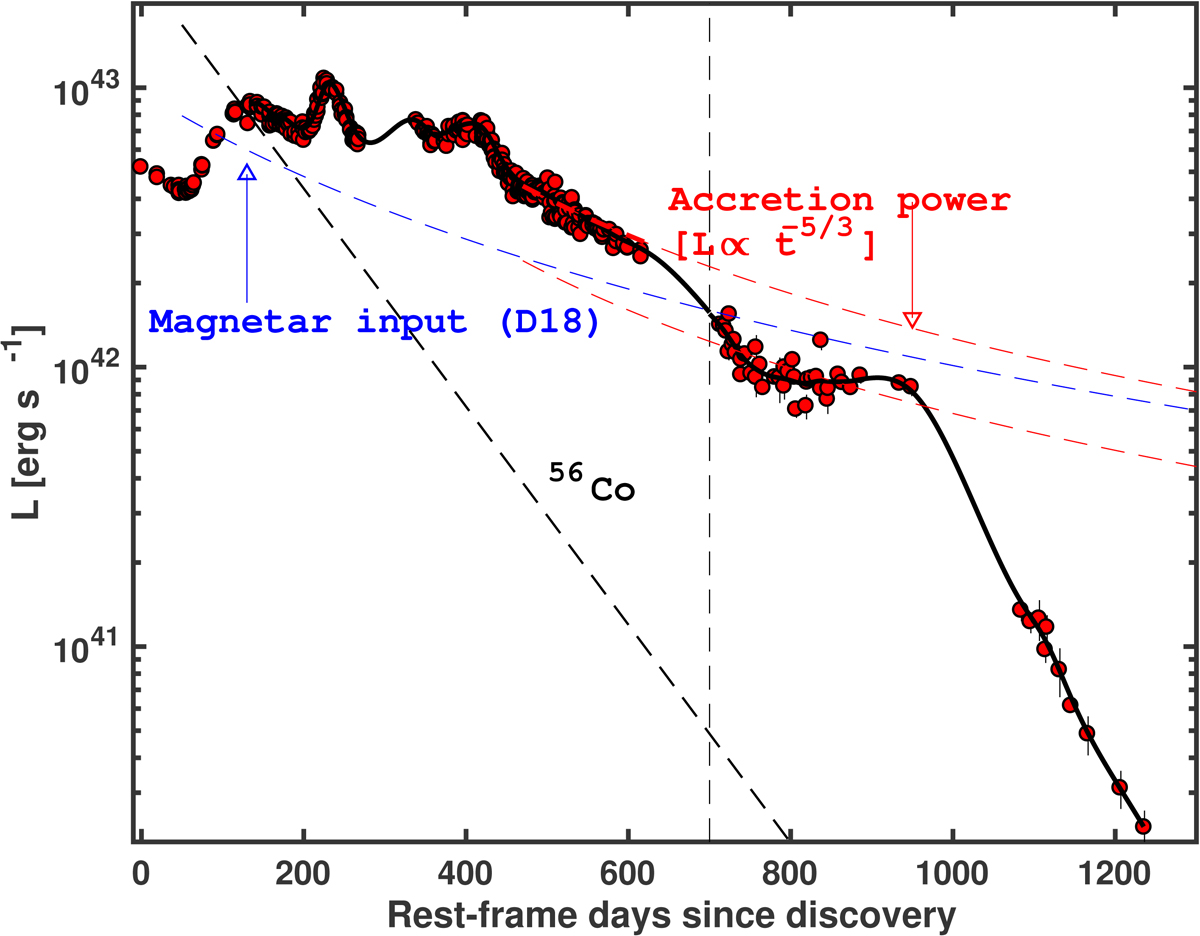
iPTF14hls bolometric LC. The solid black line is the bolometric LC obtained from the spline-interpolated photometry – that is, from the dashed curves in Fig. 2. We also show a PL (dashed red line) with n = −5/3 fitting the epochs between 470 and 620 d. The PL does not reproduce the luminosity at later epochs. If we instead scale the PL to fit the epochs between 700 and 950 d, it is still not in accordance with the fast decline after 950 d. We also report the 56Co power input (black dashed line), which would require an unfeasible amount of nickel to power the +950 d decline. The magnetar energy input (blue dashed line) from Dessart (2018) roughly reproduces the LC decline until 950 d, but not the following sharp decline.
Current usage metrics show cumulative count of Article Views (full-text article views including HTML views, PDF and ePub downloads, according to the available data) and Abstracts Views on Vision4Press platform.
Data correspond to usage on the plateform after 2015. The current usage metrics is available 48-96 hours after online publication and is updated daily on week days.
Initial download of the metrics may take a while.