Fig. 2.
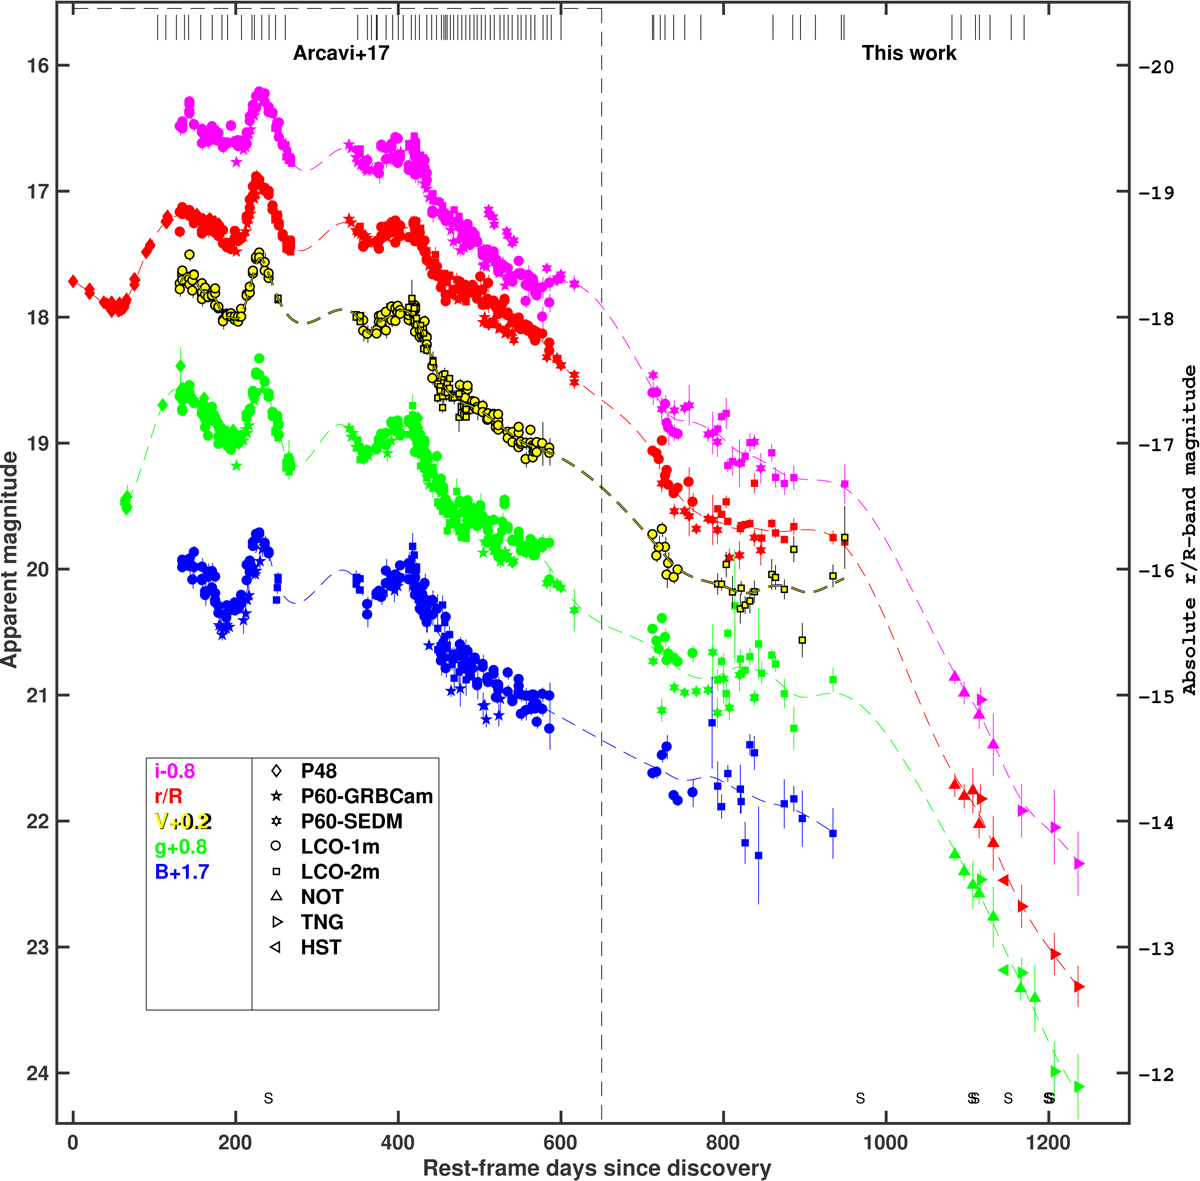
Photometric observations of iPTF14hls. The data from the first 600 d, to the left of the vertical dashed line, are from A17. We have used the same telescopes for the continued monitoring, as well as NOT, TNG, and HST for the latest epochs. The vertical bars on top of the plot indicate epochs of spectroscopic observations, and the “S” symbols in the bottom part indicate the epochs of Swift observations. The dashed coloured lines represent a combination of two tension splines to provide a continuous representation of the light curves. On the right-hand ordinate we report the absolute magnitude for the r/R band. To obtain the absolute magnitudes for the BgVi bands, their apparent magnitudes must be shifted by −36.024 mag, −36.019 mag, −36.010 mag, and −35.993 mag, respectively.
Current usage metrics show cumulative count of Article Views (full-text article views including HTML views, PDF and ePub downloads, according to the available data) and Abstracts Views on Vision4Press platform.
Data correspond to usage on the plateform after 2015. The current usage metrics is available 48-96 hours after online publication and is updated daily on week days.
Initial download of the metrics may take a while.