Fig. 12.
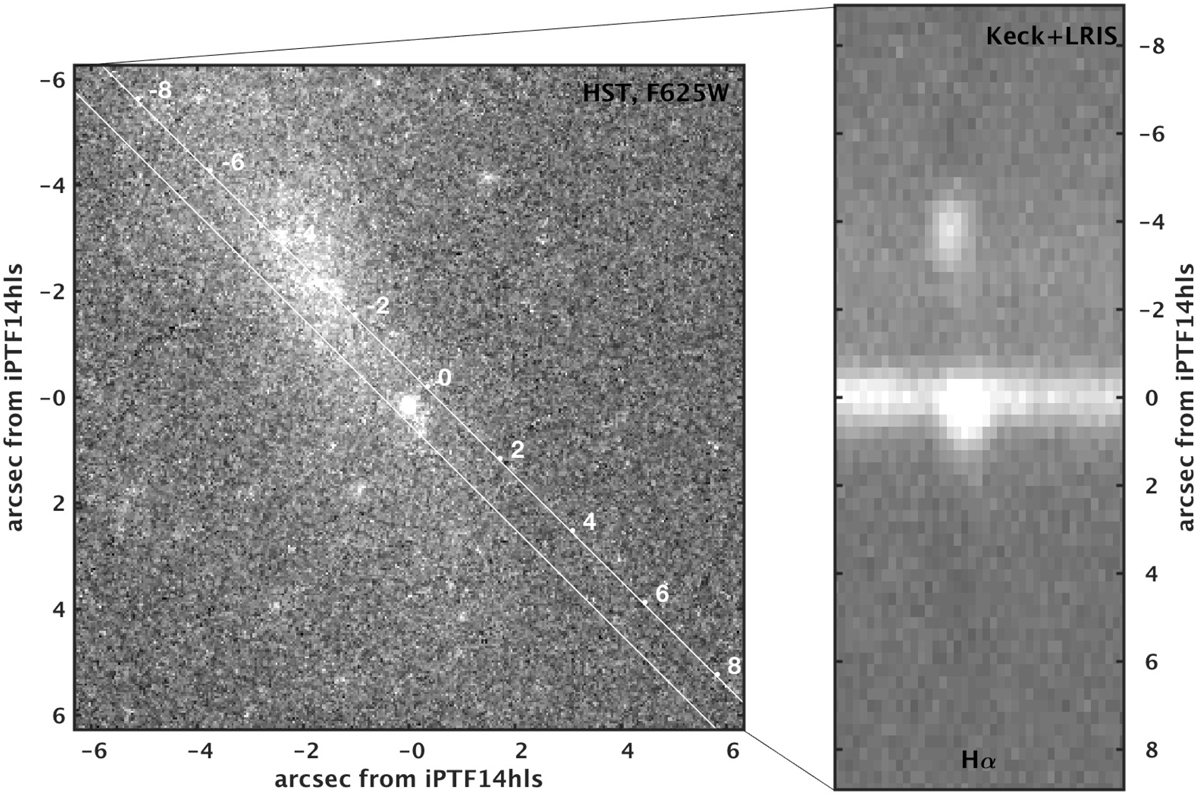
Slit position marked (white lines) on the HST F625W image of iPTF14hls and the corresponding Hα region of the two-dimensional spectrum obtained with Keck I on 4 January 2018. In this image we see two of the three H II regions along the slit positioned along the host galaxy. One additional H II region is at the other end of the galaxy, while the ones here are close to the middle of the host, and one component of the narrow emission is located just at the SN position. The position angle of the slit was 226° in this last LRIS spectrum. In our earlier LRIS spectrum, no unresolved lines were detected. The slightly different position angle of the latter slit, 261°, explains why we do not pick up emission from the host galaxy, since the slit missed most of the galaxy at this angle. However, there is also no sign of narrow emission at the SN site at this phase, which is more puzzling. One arcsecond corresponds to 720 pc. Next to iPTF14hls an H II region can be discerned.
Current usage metrics show cumulative count of Article Views (full-text article views including HTML views, PDF and ePub downloads, according to the available data) and Abstracts Views on Vision4Press platform.
Data correspond to usage on the plateform after 2015. The current usage metrics is available 48-96 hours after online publication and is updated daily on week days.
Initial download of the metrics may take a while.