Free Access
Fig. 10.
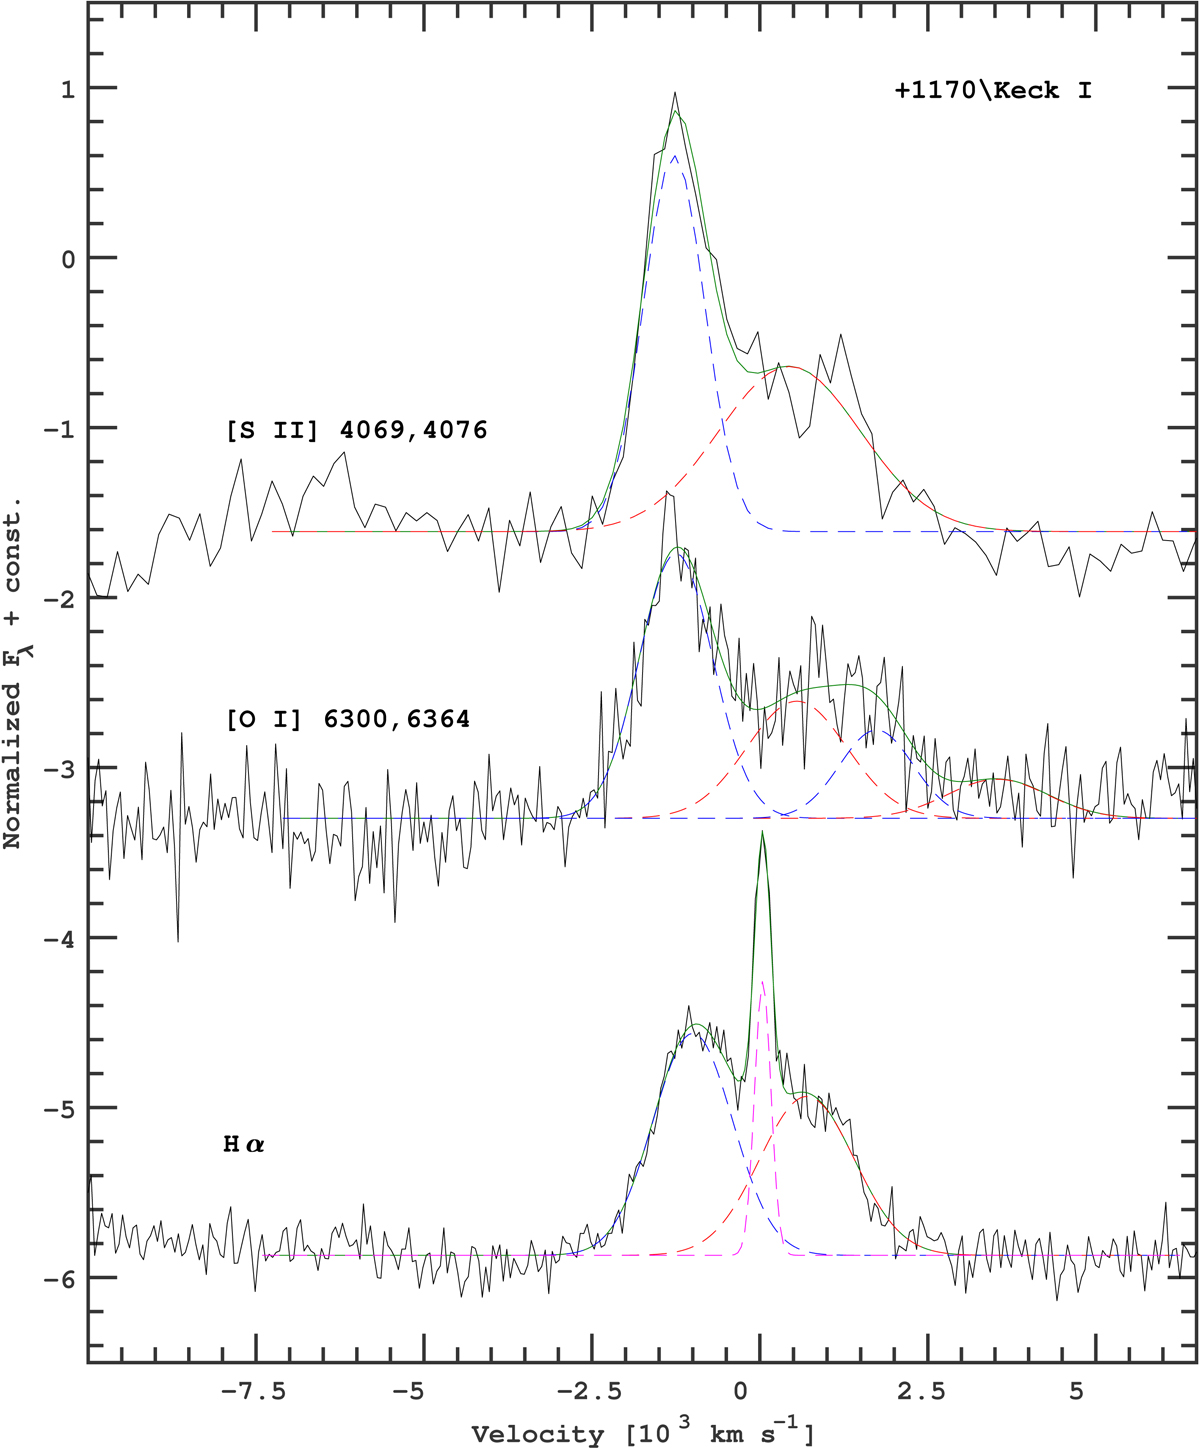
Gaussian fits to three strong emission lines in the last Keck spectrum. The [S II] λλ4069, 4076, [O I] λλ6300, 6364 and Hα profiles are here shown in common velocity space (the zero velocities correspond to 4068.6 Å, 6300.3 Å, and 6562.8 Å, respectively). The decompositions into Gaussians are tabulated in Table 4.
Current usage metrics show cumulative count of Article Views (full-text article views including HTML views, PDF and ePub downloads, according to the available data) and Abstracts Views on Vision4Press platform.
Data correspond to usage on the plateform after 2015. The current usage metrics is available 48-96 hours after online publication and is updated daily on week days.
Initial download of the metrics may take a while.