Fig. 8.
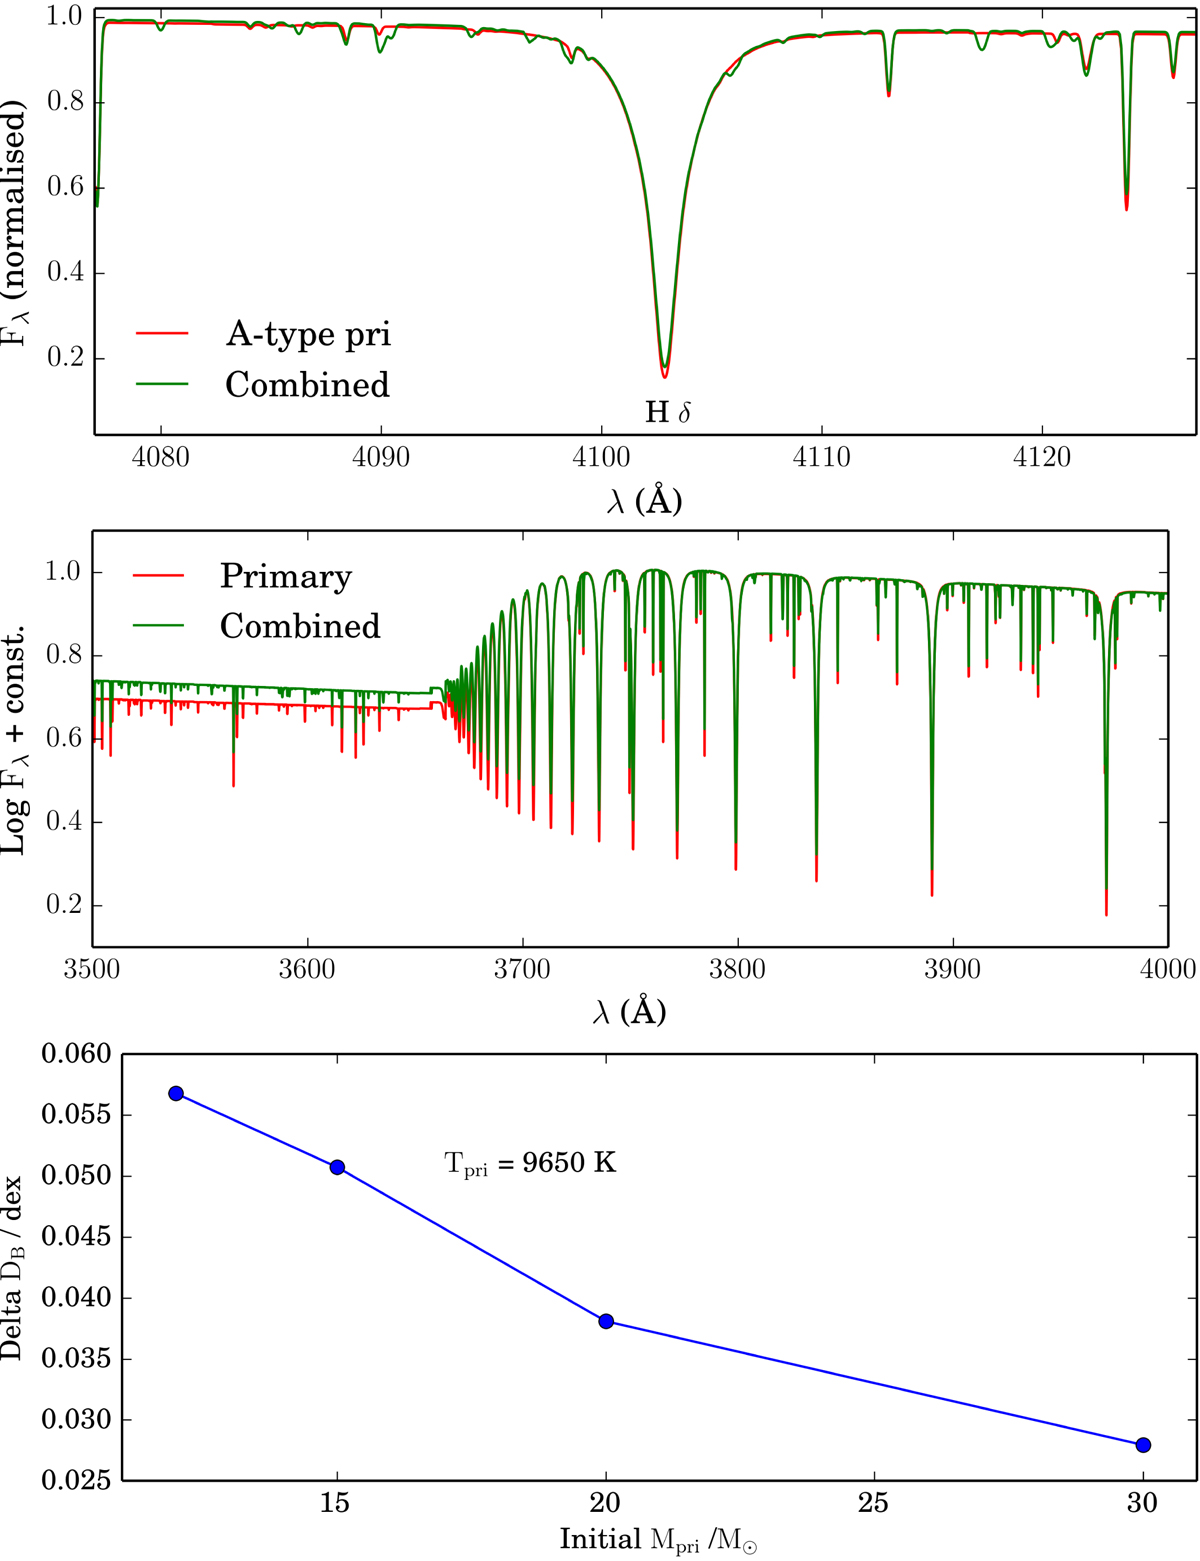
CMFGEN model spectra computed at the end of the BSG stage using outputs from our MESA binary models, taken from the same binary models as in Fig. 7, but at a later evolutionary stage. The red line profiles indicate the CMFGEN model spectrum of a primary star with T = 9650 K and log(g) = 1.50 dex. The green line indicates a combination of the model spectrum of the primary star with T = 9650 K and log(g) = 1.50 dex and the secondary star with T = 26 000 K and log(g) = 3.50 dex. The flux ratio of the primary to the secondary below the Balmer jump is 3.0. Top panel: Hδ line for the primary (red) and combined spectra (green). Middle panel: Balmer jump for the primary (A-type supergiant; red) and combined spectrum (green). Fluxes are normalised at 3790 Å for clarity. Bottom panel: change in Balmer jump in the combined spectrum relative to the primary spectrum, as a function of initial primary mass. The combined spectrum has the lower Balmer jump.
Current usage metrics show cumulative count of Article Views (full-text article views including HTML views, PDF and ePub downloads, according to the available data) and Abstracts Views on Vision4Press platform.
Data correspond to usage on the plateform after 2015. The current usage metrics is available 48-96 hours after online publication and is updated daily on week days.
Initial download of the metrics may take a while.