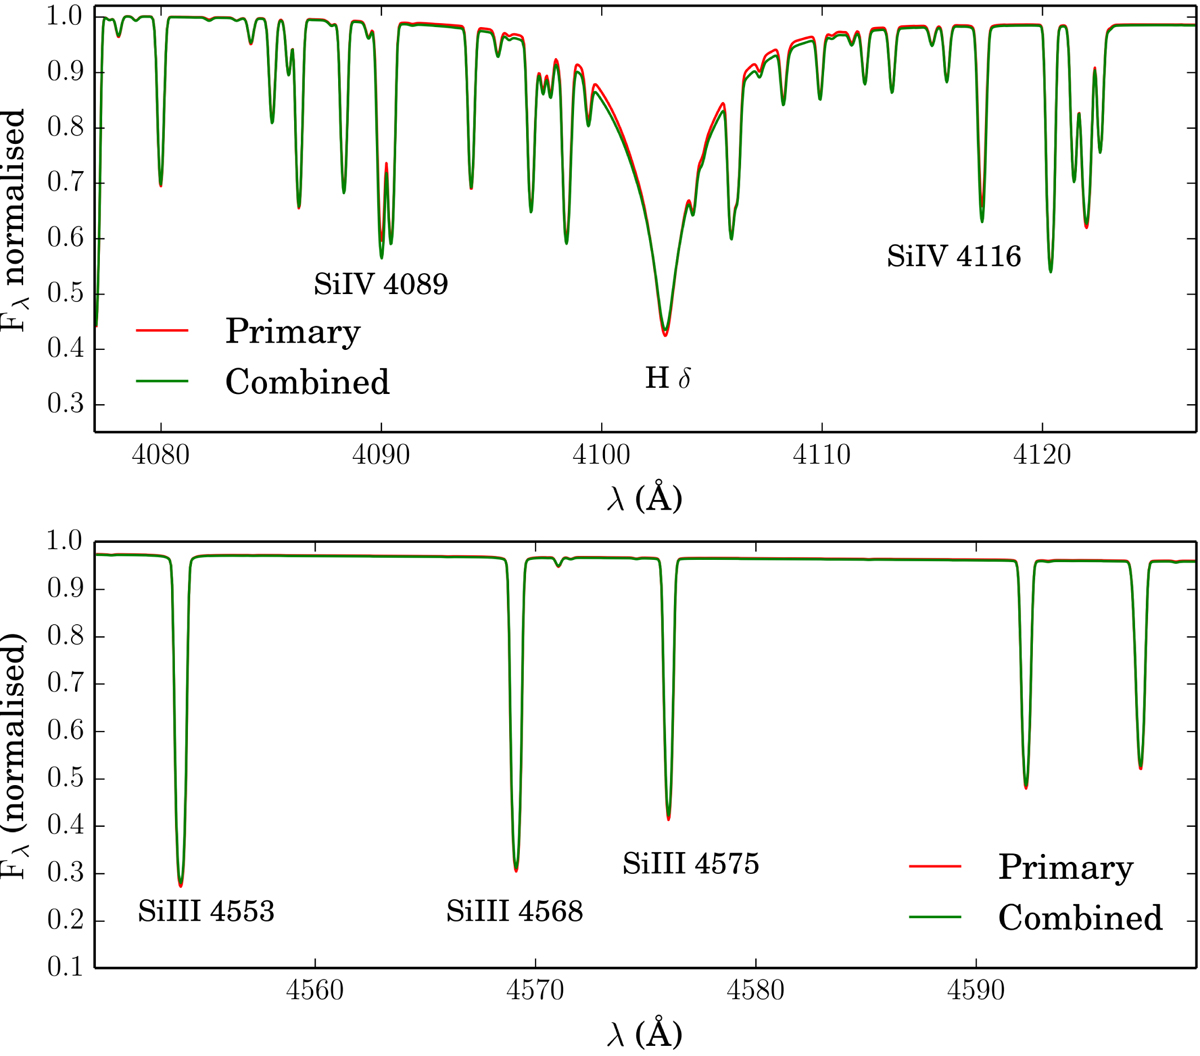
Fig. 7.

CMFGEN model spectrum computed at the beginning of the BSG stage using outputs from our MESA binary models for a representative system of a 20 M⊙ BSG primary and an 18 M⊙ (MS) secondary. The red line profiles indicate the CMFGEN model spectrum of a primary star with T = 23 000 K and log(g) = 3.0 dex. The green line indicates a combination of the model spectrum of the primary star with T = 23 000 K and log(g) = 3.00 dex and the secondary star with T = 26 000 K and log(g) = 3.50 dex. The flux ratio of the primary to the secondary in the B band at the stage when the spectra are computed is FB, pri/FB, sec = 2.3. Top panel: spectral region around the Hδ line which is one of the diagnostics for log g. Bottom panel: spectral region around SiII lines at 4553, 4568 and 4575 Å, which are ![]() diagnostics along with SiII and SiIV lines.
diagnostics along with SiII and SiIV lines.
Current usage metrics show cumulative count of Article Views (full-text article views including HTML views, PDF and ePub downloads, according to the available data) and Abstracts Views on Vision4Press platform.
Data correspond to usage on the plateform after 2015. The current usage metrics is available 48-96 hours after online publication and is updated daily on week days.
Initial download of the metrics may take a while.


