Fig. 3.
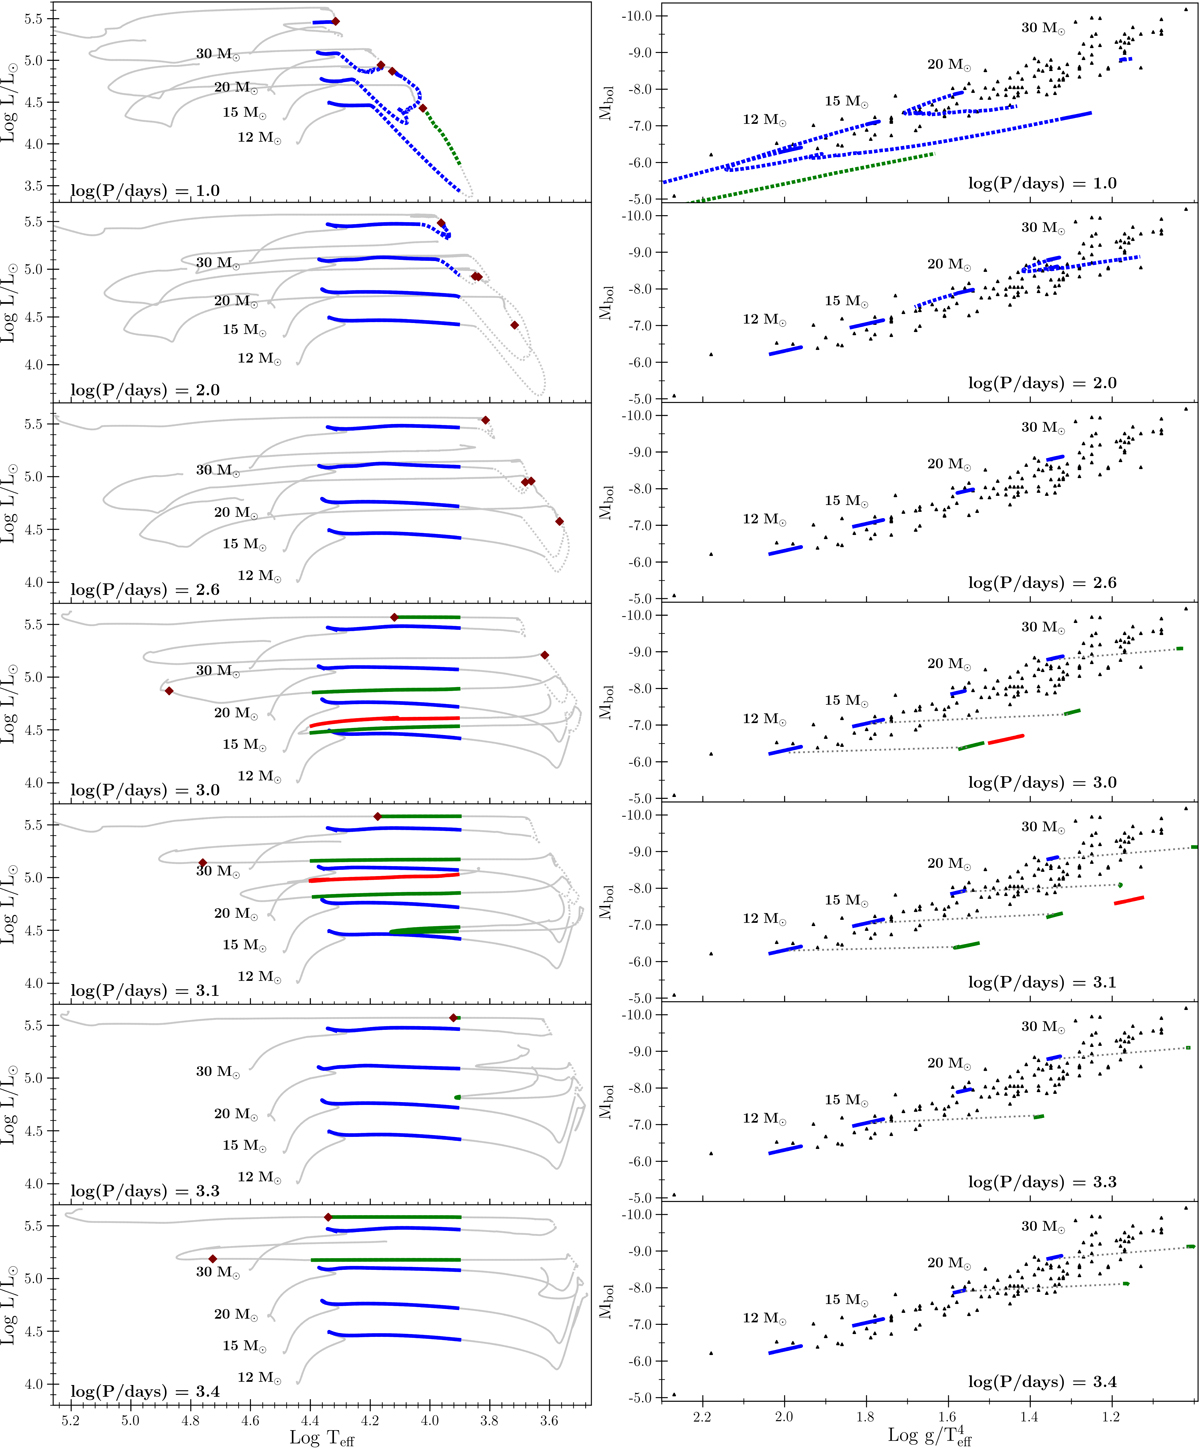
Left panels: HR diagrams for primary stars in MESA models, with initial masses of 12, 15, 20 and 30 M⊙, mass ratio of q = 0.9 and Z = 0.020. Blue, green and red indicate first, second and third BSG stages respectively. The dashed line indicates the period during which mass transfer takes place. Not all parts of the track crossing the BSG after a RSG stage are in green. This is because we define that a BSG has a hydrogen surface fraction X > 0.5. The maroon diamond indicates the evolutionary point at which the hydrogen surface abundance drops below 0.5. Right panels: Mbol vs. Log ![]() planes for same models as in left panels. The colours have the same meaning as the left panels. Observations sources are listed in caption of Fig. 2. Light grey dashed lines join the first and second BSG stages from the same model.
planes for same models as in left panels. The colours have the same meaning as the left panels. Observations sources are listed in caption of Fig. 2. Light grey dashed lines join the first and second BSG stages from the same model.
Current usage metrics show cumulative count of Article Views (full-text article views including HTML views, PDF and ePub downloads, according to the available data) and Abstracts Views on Vision4Press platform.
Data correspond to usage on the plateform after 2015. The current usage metrics is available 48-96 hours after online publication and is updated daily on week days.
Initial download of the metrics may take a while.