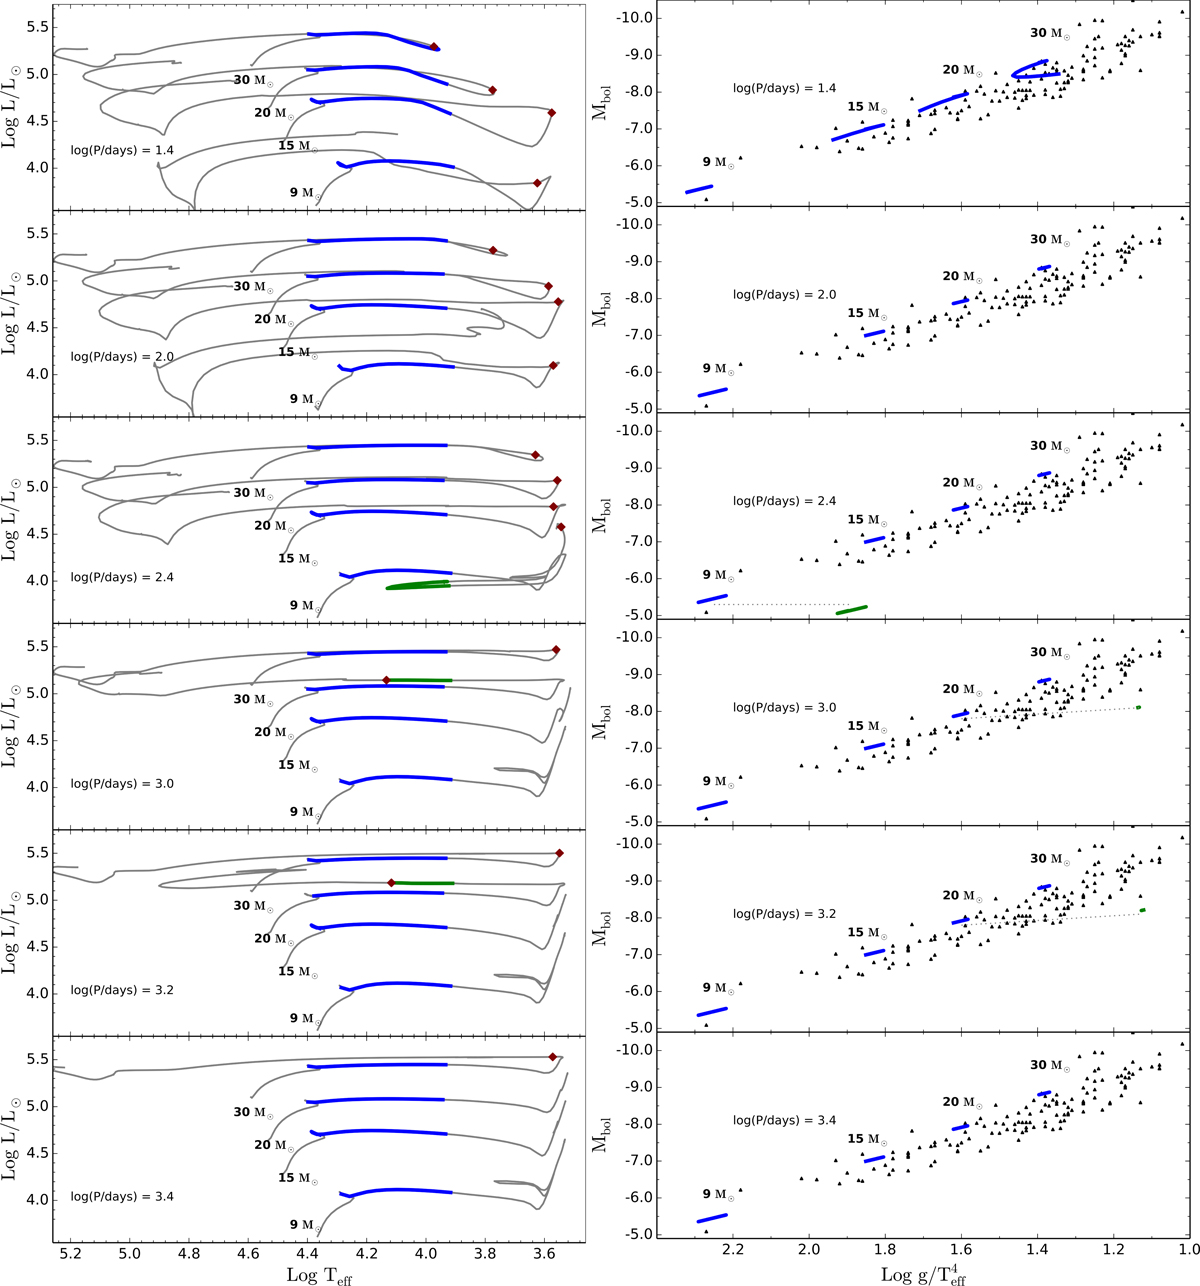
Fig. 2.

Left panels: HR diagram for BPASS models (primary stars only) with initial periods of log(P/days) = 1.4, 2.0, 2.4, 3.0, 3.2, 3.4, where P is in days. Initial masses are 9, 15, 20 and 30 M⊙ with a mass ratio of 0.9. Blue and green indicate first and second BSG stages respectively. Not all parts of the track crossing the BSG after a RSG stage are in green. This is because we define that a BSG has a hydrogen surface fraction X > 0.5. The maroon diamond indicates the evolutionary point at which the hydrogen surface abundance drops below 0.5. Right panels: Mbol vs. Log ![]() planes for the same models as in the left panels. The colours have the same meaning as the left panels. Black triangles represent observations of individual BSGs. The observations are taken from NGC 300 (Kudritzki et al. 2008b), other galaxies (Kudritzki et al. 2008a), M 33 (Vivian et al. 2009), M 81 (Kudritzki et al. 2012), WLM (Urbaneja et al. 2008), NGC 3109 (Hosek et al. 2014), NGC 3621 (Kudritzki et al. 2014) and NGC 4258 (Kudritzki et al. 2013). Light grey dashed lines join the first and second BSG stages from the same model.
planes for the same models as in the left panels. The colours have the same meaning as the left panels. Black triangles represent observations of individual BSGs. The observations are taken from NGC 300 (Kudritzki et al. 2008b), other galaxies (Kudritzki et al. 2008a), M 33 (Vivian et al. 2009), M 81 (Kudritzki et al. 2012), WLM (Urbaneja et al. 2008), NGC 3109 (Hosek et al. 2014), NGC 3621 (Kudritzki et al. 2014) and NGC 4258 (Kudritzki et al. 2013). Light grey dashed lines join the first and second BSG stages from the same model.
Current usage metrics show cumulative count of Article Views (full-text article views including HTML views, PDF and ePub downloads, according to the available data) and Abstracts Views on Vision4Press platform.
Data correspond to usage on the plateform after 2015. The current usage metrics is available 48-96 hours after online publication and is updated daily on week days.
Initial download of the metrics may take a while.


