Fig. 1.
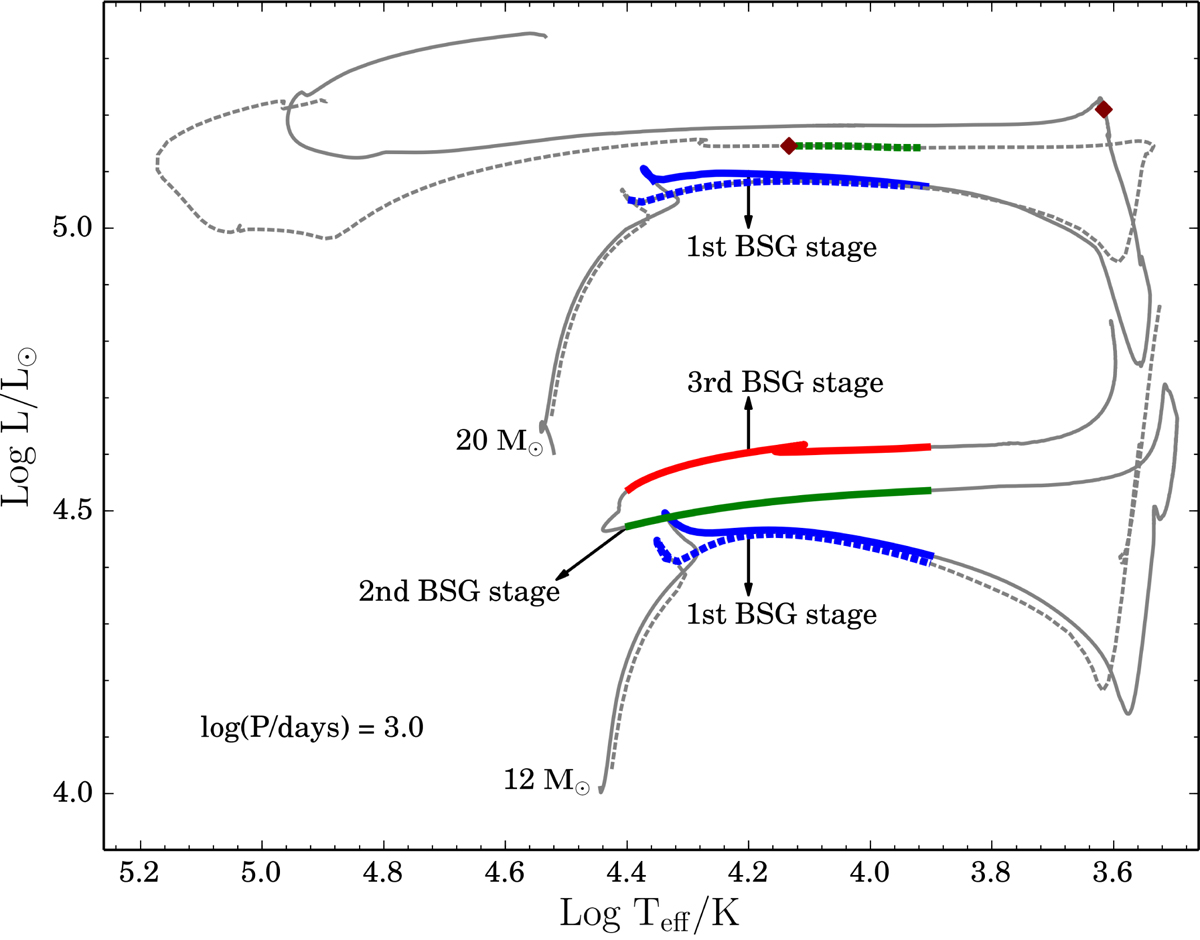
Evolutionary tracks for primary stars of masses 12 and 20 M⊙ for BPASS models (dashed line) and MESA models (solid line). The initial orbital period is log(P/days) = 3.0. Blue, green and red indicate the first, second and third BSG stages respectively. The maroon diamond indicates the evolutionary point at which the hydrogen surface abundance drops below 0.5.
Current usage metrics show cumulative count of Article Views (full-text article views including HTML views, PDF and ePub downloads, according to the available data) and Abstracts Views on Vision4Press platform.
Data correspond to usage on the plateform after 2015. The current usage metrics is available 48-96 hours after online publication and is updated daily on week days.
Initial download of the metrics may take a while.