Fig. 6.
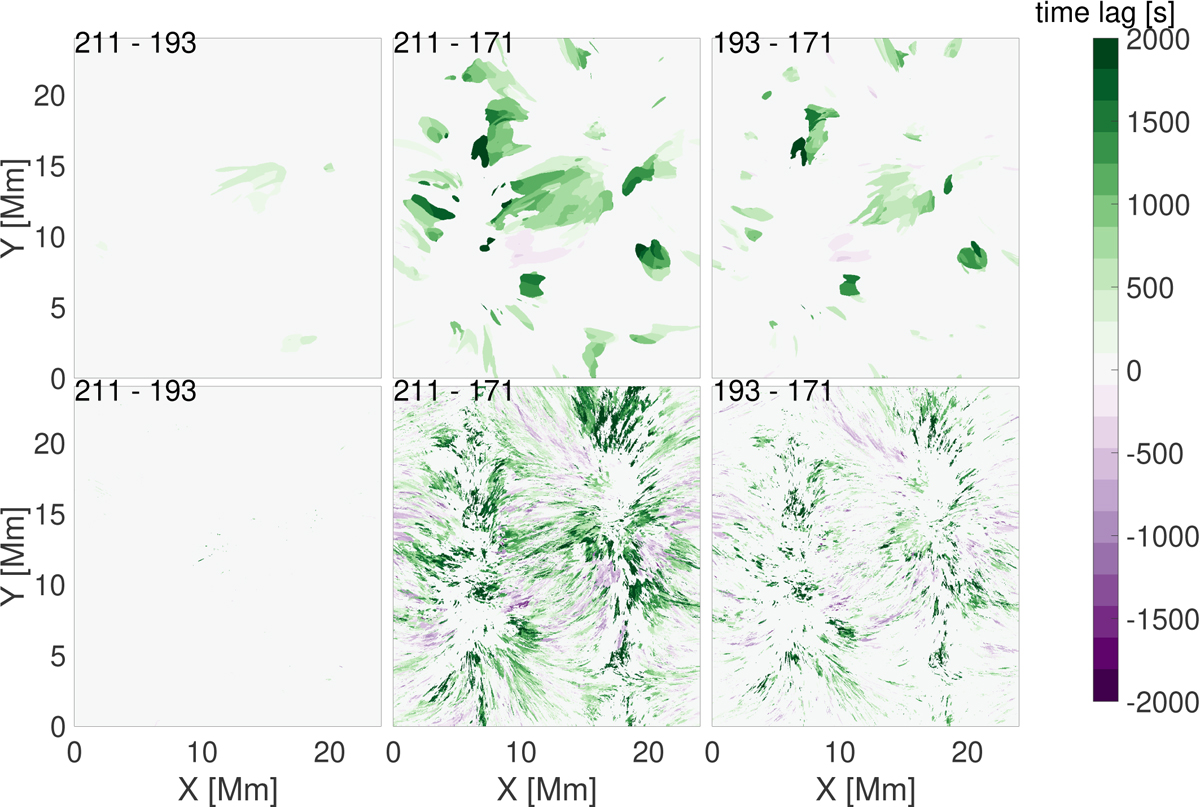
top row: time-lag maps between pairs of filters considering total column mass of the solar corona. Negative values indicate that the first component lagged behind the second one. bottom row: same as in the top group of images, but for regions that exhibit only heating events. The percentages of surface coverage by non-zero time-lags are listed in Table 1.
Current usage metrics show cumulative count of Article Views (full-text article views including HTML views, PDF and ePub downloads, according to the available data) and Abstracts Views on Vision4Press platform.
Data correspond to usage on the plateform after 2015. The current usage metrics is available 48-96 hours after online publication and is updated daily on week days.
Initial download of the metrics may take a while.