Fig. 4.
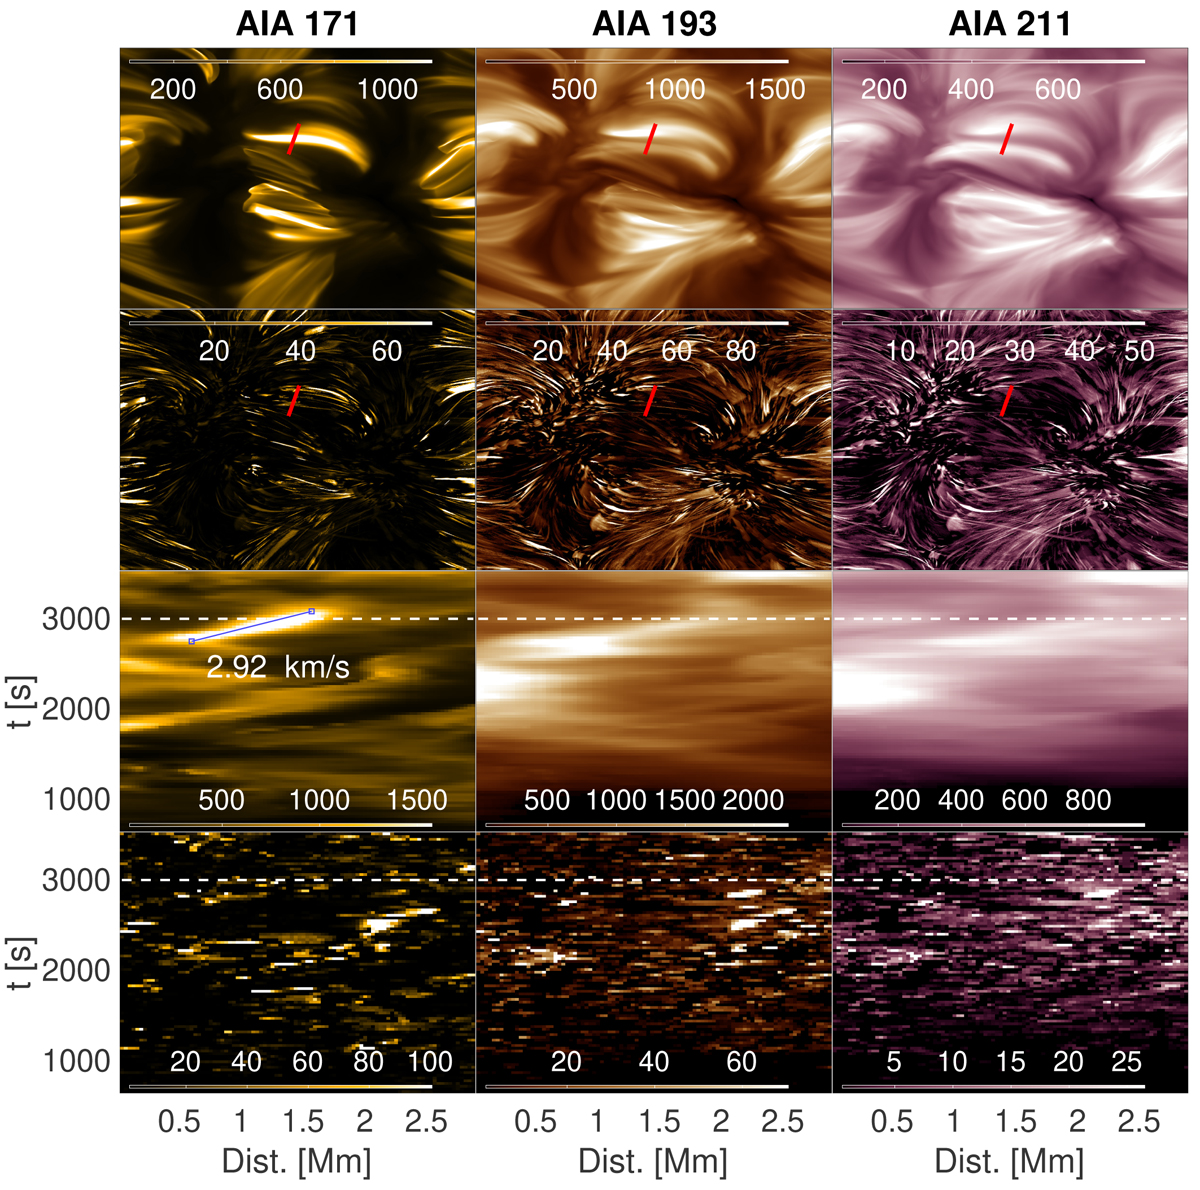
Top row: intensity of three EUV AIA filters for the total column mass case (all regions). The red line represents a slit with one pixel width on top of a loop-like structure chosen at t = 2990 s in the 171Å filter. Second row: same as the top row, but for regions exhibiting heating events. Third and fourth rows: time-distance maps of intensity. The dashed white line indicates the time-step used for the slit. Velocity was calculated in the range denoted by the blue line. We measured distance and velocity from the south side of red and blue lines, respectively. Intensity is in units of DN/s/pix.
Current usage metrics show cumulative count of Article Views (full-text article views including HTML views, PDF and ePub downloads, according to the available data) and Abstracts Views on Vision4Press platform.
Data correspond to usage on the plateform after 2015. The current usage metrics is available 48-96 hours after online publication and is updated daily on week days.
Initial download of the metrics may take a while.