Fig. 3.
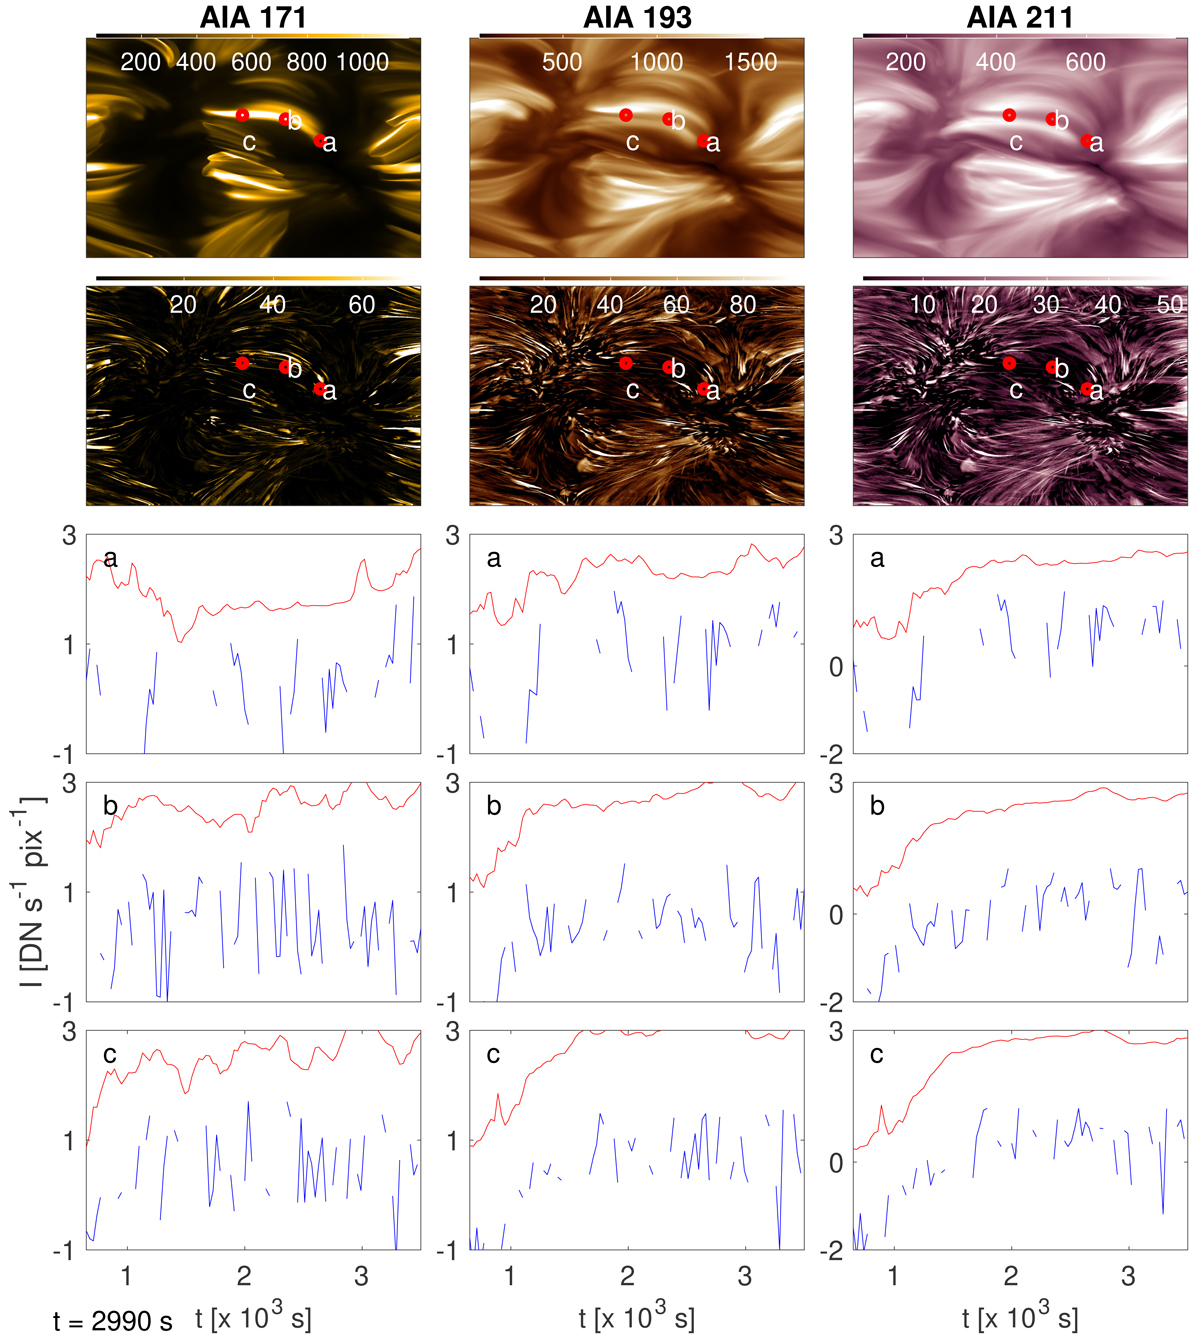
Top row: intensity of three EUV AIA filters for the total column mass case (i.e. all regions). The three red cycles, selected in 171Å filter at t = 2990, track intensity at every time-step. Second row: same as in top row but for regions that exhibit only heating events (i.e. flaring). Third to fifth rows: plots of the evolution of intensity. Red coloured lines depict intensity calculated assuming total column mass, while blue-coloured lines depict intensity evolution for regions that exhibit only heating events. Pixel size is the simulations pixel size.
Current usage metrics show cumulative count of Article Views (full-text article views including HTML views, PDF and ePub downloads, according to the available data) and Abstracts Views on Vision4Press platform.
Data correspond to usage on the plateform after 2015. The current usage metrics is available 48-96 hours after online publication and is updated daily on week days.
Initial download of the metrics may take a while.