Fig. 9
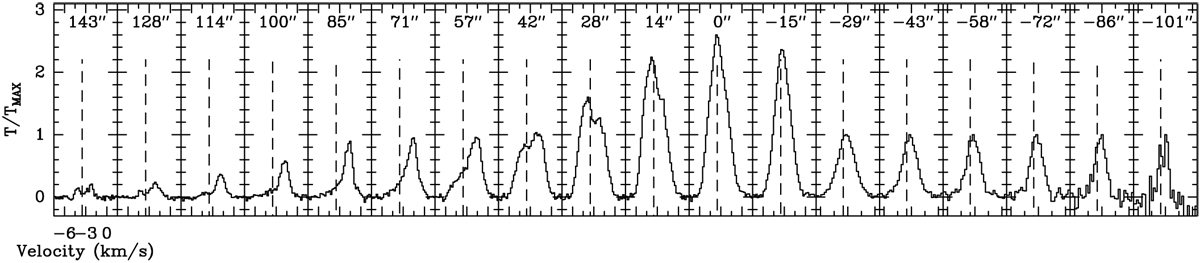
C18O spectra across the main axis of G351 in the most quiescent northern part of the filament. Spectra are collapsed parallel to the main axis. Each spectrum is normalised to its peak intensity value for visualisation. The numbers in each panel indicate the distance from the spine of G351. The label 0′′ denotes the spine. The dashed line indicates a reference velocity of − 3.5 km s−1 (see Fig. 5).
Current usage metrics show cumulative count of Article Views (full-text article views including HTML views, PDF and ePub downloads, according to the available data) and Abstracts Views on Vision4Press platform.
Data correspond to usage on the plateform after 2015. The current usage metrics is available 48-96 hours after online publication and is updated daily on week days.
Initial download of the metrics may take a while.