Free Access
Fig. 5
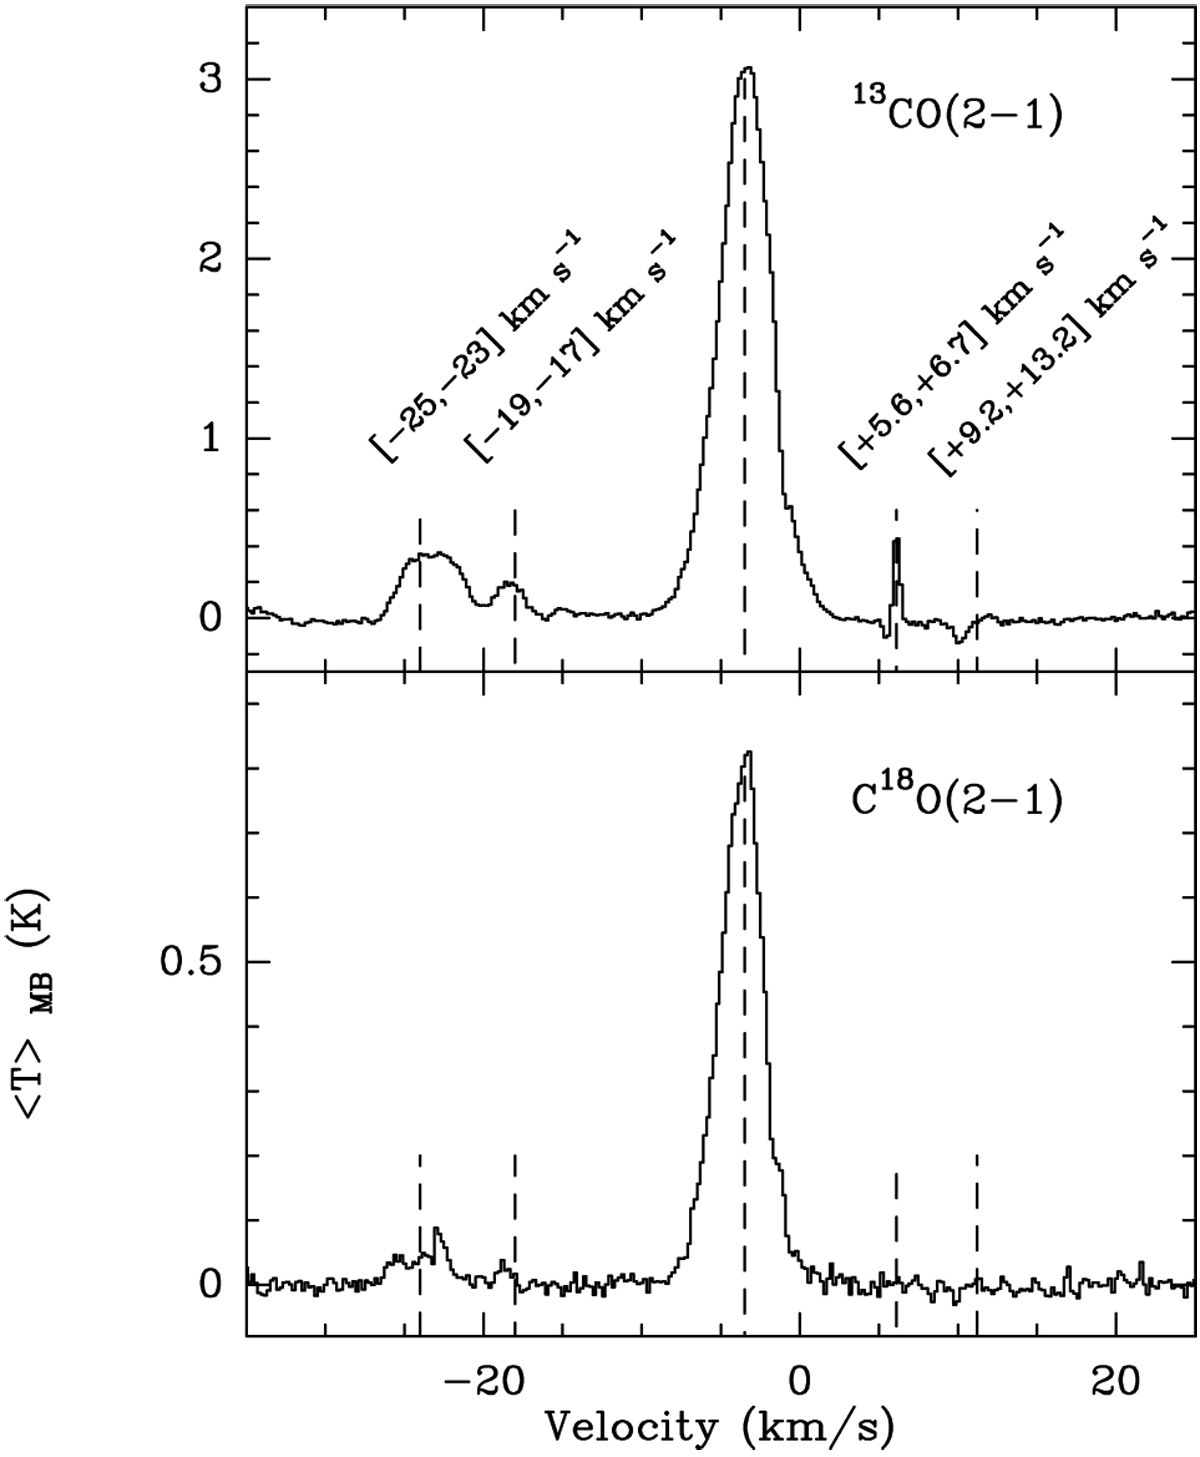
Averaged 13CO (2–1) (top panel) and C18O (2–1) (bottom panel) spectra over the full extent of the APEX map. The dashed lines indicate vLSR of −18, −24, −3.5, +6, and + 11 km s−1. The velocityranges used to obtain the integrated intensity maps shown in Fig. A.4 are also shown.
Current usage metrics show cumulative count of Article Views (full-text article views including HTML views, PDF and ePub downloads, according to the available data) and Abstracts Views on Vision4Press platform.
Data correspond to usage on the plateform after 2015. The current usage metrics is available 48-96 hours after online publication and is updated daily on week days.
Initial download of the metrics may take a while.