Fig. 4
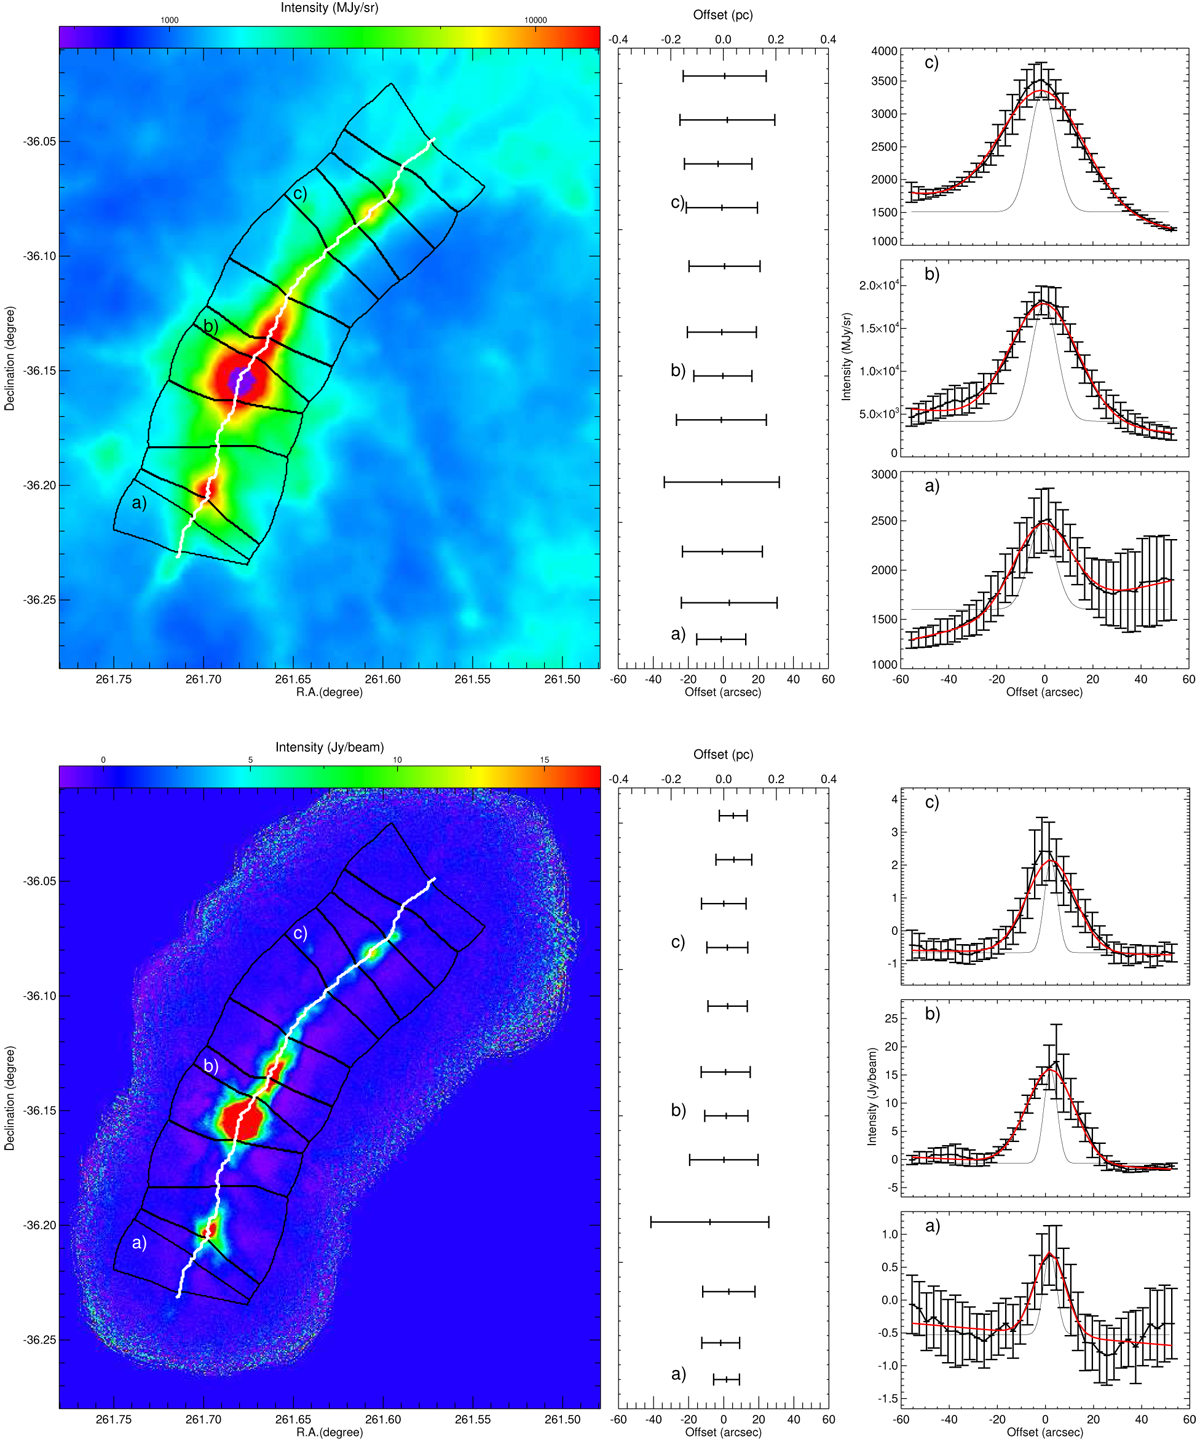
Top panels: Hi-GAL-250 μm map of G351 (left panel). The white solid line indicates the skeleton of the filament obtained from the Hi-GAL data. The map is divided in different regions for the estimate of the filament width along the source. Middle panel: full width at half maximum inarcsec in different regions of the filament. The cross-spine average radial profile of the observed intensity in the Hi-GAL-250 μm data (black thick line, right panel) is given for three regions (a, b, and c; these are also shown in the other two panels) along G351.The solid red line is the Gaussian fit; the thin black line shows the resolution of the data. The error bars show the dispersion of the measurements in the relative region. Bottom panels: as for the top panels but for the SABOCA data.
Current usage metrics show cumulative count of Article Views (full-text article views including HTML views, PDF and ePub downloads, according to the available data) and Abstracts Views on Vision4Press platform.
Data correspond to usage on the plateform after 2015. The current usage metrics is available 48-96 hours after online publication and is updated daily on week days.
Initial download of the metrics may take a while.