Free Access
Fig. 2
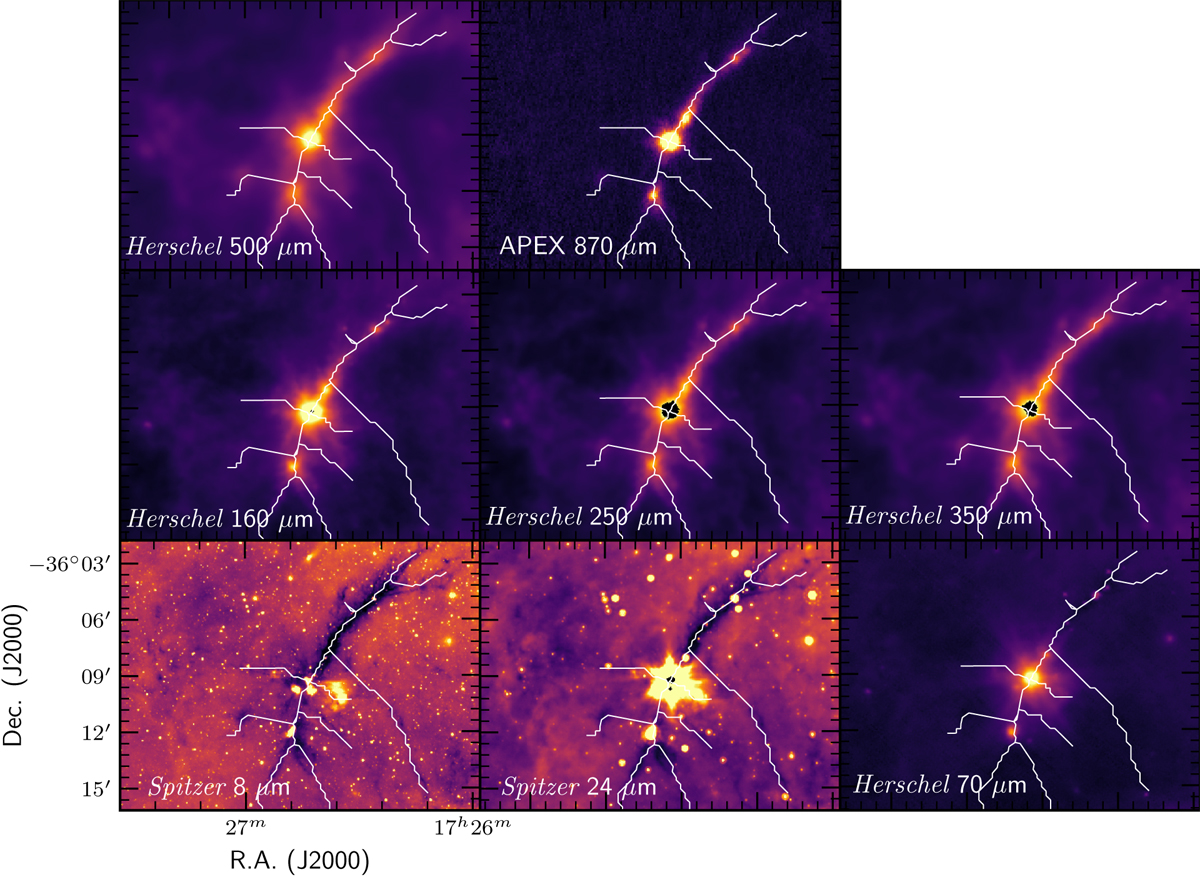
Continuum images of G351 at different wavelengths from 8 μm with Spitzer (bottom left panel) to 870 μm with ATLASGAL-LABOCA. The LABOCA data are affected by filtering of large-scale emission (e.g. Schuller et al. 2009). The solid white line in each panel denotes the skeleton of G351 and of the branches.
Current usage metrics show cumulative count of Article Views (full-text article views including HTML views, PDF and ePub downloads, according to the available data) and Abstracts Views on Vision4Press platform.
Data correspond to usage on the plateform after 2015. The current usage metrics is available 48-96 hours after online publication and is updated daily on week days.
Initial download of the metrics may take a while.