Fig. A.4
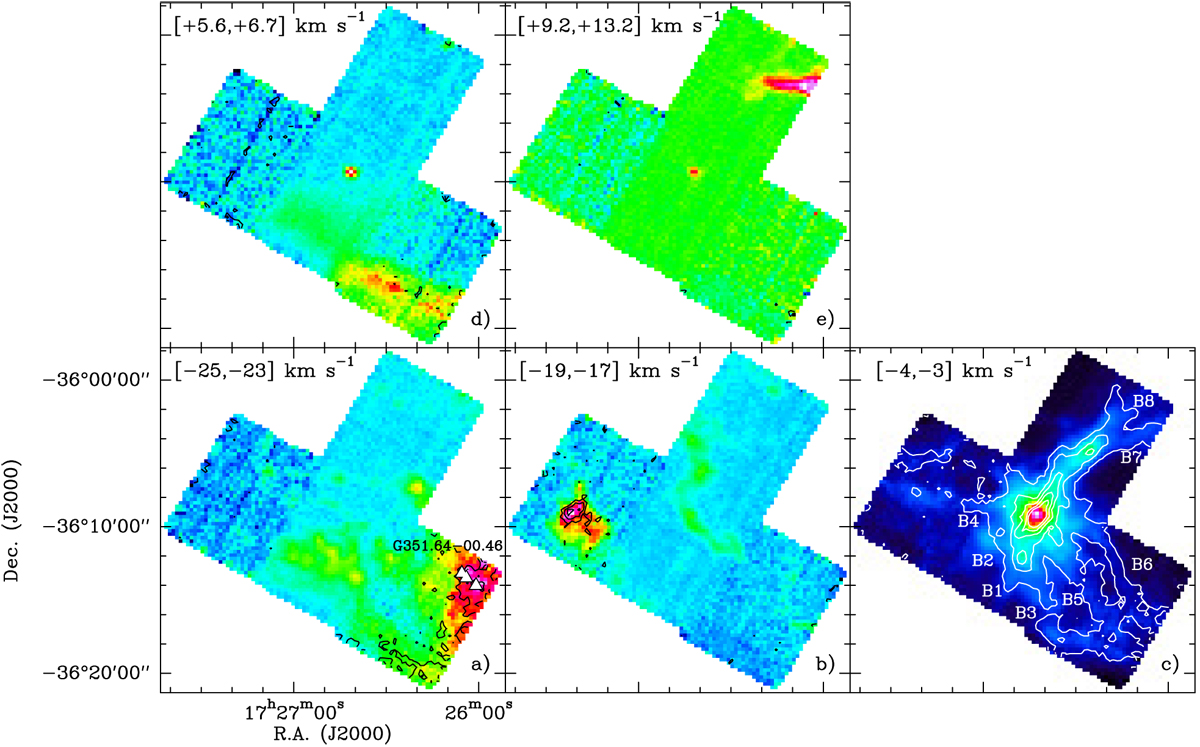
Integrated emission of the 13CO (2–1) line over five different velocity ranges (see Fig. 5) is shown in colour scale. The point-like emission seen towards Clump-1 in the [+5.6, +6.7] km s−1 and [+9.2, +13.2] km s−1 velocity ranges is due to high-velocity emission associated with molecular outflows (see Leurini et al. 2009). Black contours show the corresponding integrated C18O (2–1) emission from 30% of its peak emission in steps of 30%. The white contours in the bottom right panel show the integrated C18O (2–1) emission in the range − 3.5 ± 0.5 km s−1 from 5 to 45% of the corresponding peak emission in steps of 10%. The B1–B8 labels are as in Fig. 1.
Current usage metrics show cumulative count of Article Views (full-text article views including HTML views, PDF and ePub downloads, according to the available data) and Abstracts Views on Vision4Press platform.
Data correspond to usage on the plateform after 2015. The current usage metrics is available 48-96 hours after online publication and is updated daily on week days.
Initial download of the metrics may take a while.