Free Access
Fig. A.2
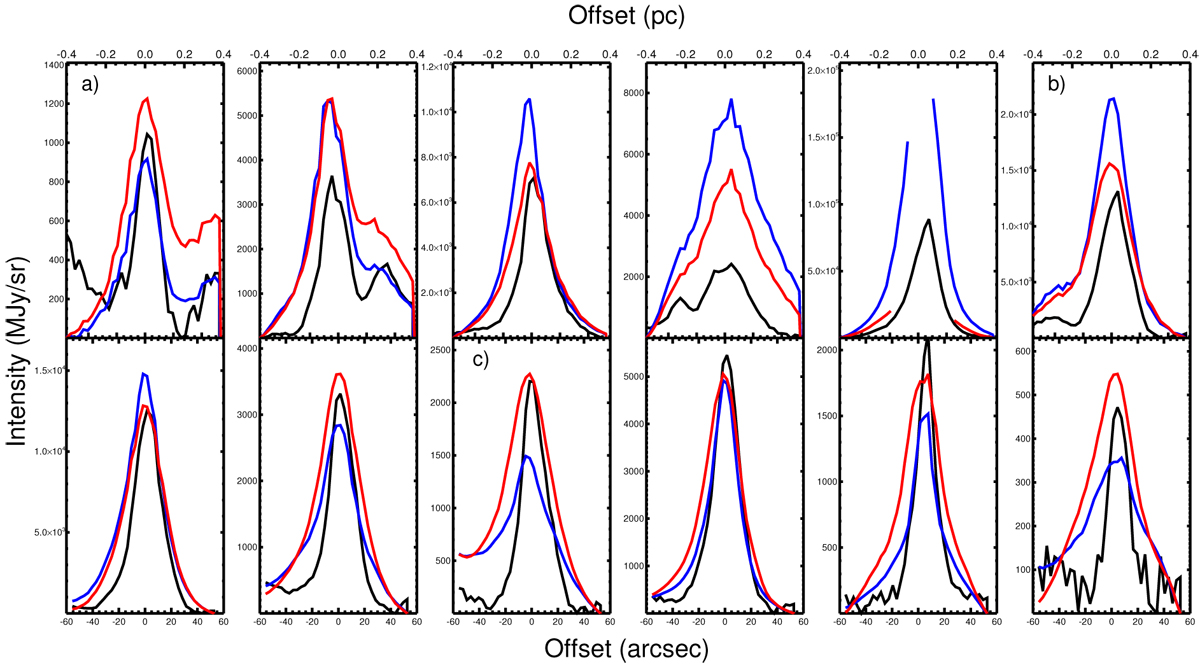
Average radial profile of G351 estimated from the SABOCA emission at 350 μm emission (solid black line), Hi-GAL-250 μm (red), and Hi-GAL-160 μm data (blue). The panels show the 12 regions of Fig. 4 ordered from top left to bottom right.
Current usage metrics show cumulative count of Article Views (full-text article views including HTML views, PDF and ePub downloads, according to the available data) and Abstracts Views on Vision4Press platform.
Data correspond to usage on the plateform after 2015. The current usage metrics is available 48-96 hours after online publication and is updated daily on week days.
Initial download of the metrics may take a while.