Free Access
Fig. 11
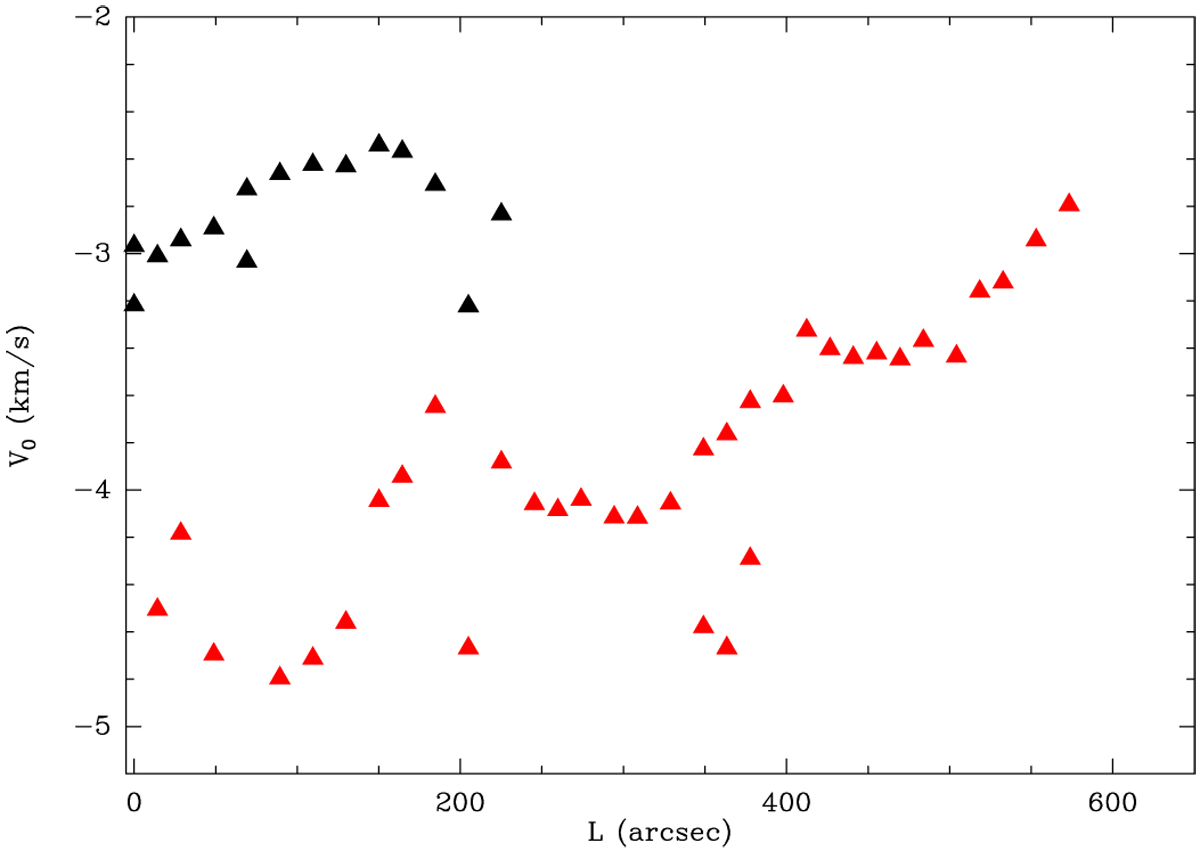
C18O (2–1) velocity centroid as a function of position along the spine of Branch-6. The red and black triangles refer to the two different velocity groups identified by the clustering algorithm.
Current usage metrics show cumulative count of Article Views (full-text article views including HTML views, PDF and ePub downloads, according to the available data) and Abstracts Views on Vision4Press platform.
Data correspond to usage on the plateform after 2015. The current usage metrics is available 48-96 hours after online publication and is updated daily on week days.
Initial download of the metrics may take a while.